The most significant difficulty facing very large SQL databases today is that they simply aren’t scalable when their table sizes approach the billions of records. So while many of the world’s SQL databases, using Oracle, MySQL, or SQL Server, still perform appreciably well even for large businesses, the rise of Internet data has enabled databases to grow larger than these businesses can cope with. Soon the “fail whale” becomes their corporate logo.
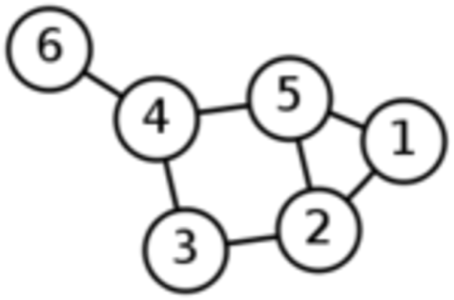
It was a problem Twitter addressed last year with an open source adaptation called FlockDB. You can perhaps visualize the structure of Twitter’s internal database in your own mind: a series of textual strips that relate to a node that represents their origin, and that are related in turn to all the nodes associated with the origin node. You’re probably seeing spheres connected by straws, like something you made in junior-high chemistry. This model of nodes and the links, or edges, that bind them to one another is called a graph database.
If your business works with a huge and growing social graph of customer data, you may soon find yourself faced with Twitter’s dilemma, as history may eventually record it. You could consider attacking it the way Twitter did, by grafting a kind of graph database manager onto your existing model. However, by Twitter’s own admission. FlockDB is not geared for traversal – for solving problems such as the shortest path between two nodes.
Infinite Graph, which RWW has covered in part before, is one other possibility. It is a from-the-ground-level-up graph database management system. And its cloud deployment model is such that you can develop and test the database for free.
“Developers know their data has a format or schema or a structure that it wants to live in, but for years they’ve been forced to put it into rows and columns,” remarks Thomas Krafft, marketing director for Objectivity, which produces Infinite Graph. “Most developers now, though, when they’re drawing diagrams on a whiteboard, tend to draw something that looks like a graph structure. You have to normalize that or translate it or do some sort of abstraction to turn that into rows and columns.”
Seeing what you’re working with
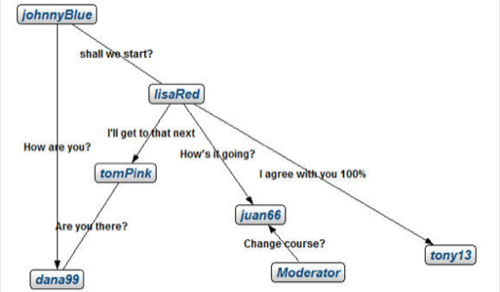
An example of a messaging database visualized with Infinite Graph 2.0.
Version 2.0 of Infinite Graph, which has just been released, includes an improved visualization tool born from the company’s long-time partnership with database tools maker Tom Sawyer Software. Here, a database schema can be conceptualized using a structure that more closely approximates the mental model. “For developers who are building something along the lines of an object-oriented paradigm,” Krafft told RWW, “a graph database allows them to build an application that directly maps to their view of the data.
“There are a greater number of available technologies that support greater scalability,” he continues, “that help developers to essentially build something that supports the data as it is. [But] when you’re building an application on a graph database, it’s really whiteboard friendly, because you’re going to draw a circle that says, here’s some node of interest, and then draw a line to some other relationship you want to explore.”
As Objectivity Senior Systems Engineer Mark Maagdenberg explains Infinite Graph’s improved visualizer, while most visualization tools are concentrated upon the data and its relationship to itself, I.G. 2.0 lets the architect discover the paths and the value of relationships – or to use his metaphor, the path between the trees as opposed to the forest. While any given node may only have a relationship with two, or a handful, of other nodes, the importance may lie with where those relationships are with respect to the entire structure – something that can’t be visualized in a tabular format.
Maagdenberg continues: “Say I have a network topology layout, a picture of all of my network devices – my routers, switches, hubs, computers. And I want to show the path going through those devices in real-time, showing the instances where a path gets cut off, where you may want to reroute it to a different path. You may want to show the shortest amount of hops between the devices, or show how the paths may heal themselves. Having a relational table to see this thing would make no sense. All you’re seeing is IP addresses.”
An overview of InfiniteGraph, the distributed graph database
View more
from
Avoiding Quassnoi’s Query
From a database architect’s perspective, crafting a way to traverse a simple table of hierarchies – say, a family ancestry chart – often leads to an unpredictable set of circumstances which predictably trigger the same headache. Suppose you’re using a SQL database to collect all the ancestors of a given record. As you go, you collect the ancestral records into a table. You know you have no more records to collect when the table you’re collecting into doesn’t change. But the criteria for your query comes from the same table, for a kind of self-knot-tying procedure called a recursive self-join.
In many circumstances, recursive self-joins don’t work because architects can’t predict the “shape” of each record in this self-evolving table, which is necessary in order for the relational database manager to keep track of the schema. Some architects have employed a method that boils down to “Select a running total from another selection made up of the remaining, unprocessed portion of this same table,” which has earned the curious moniker “Quassnoi’s Query.”
Explains Objectivity’s Krafft, “Most languages now are object-oriented, and when they’re on top of a relational database, typically there’s some sort of translation or normalization that needs to occur, or an object-relational (O.R.) mapping. The relational database, ironically, knows nothing about relationships natively. It was designed to catalog and allow you to retrieve structured information. So for years, people have been dealing with less structured information, schema evolution, and when they try to do a query that has to do a connection between me and the next set of people and the next set after me, it’s a recursive join problem which will really kill the machines. It’s trying to put a square peg in a round hole.”
In Twitter’s case, the FlockDB database may not lend itself to this particular class of problems – again, by Twitter’s own admission. From time to time, it may be interesting to know what portion of a user’s followers are following him. That’s an intersection of two sets that Twitter suggests is best handled “by decomposing it into single-user queries. Data is partitioned by node, so these queries can each be answered by a single partition, using an indexed range query.”
In Infinite Graph 2.0, information such as this may be revealed by an asynchronous navigation query. In Java, it takes the familiar object.method syntax, and takes four parameters: a guide which helps style the kind of “sweep” the search will take (usually breadth-first or depth-first), a path qualifier used to determine the validity of a path under consideration, a result qualifier used to limit the results to a set that follows given rules, and a pointer to a callback function that processes the results.
Objectivity’s business model for I.G. 2.0 is designed to get developers moving right away (by not charging them yet), and deferring the whole topic of remuneration when the complete database is ready to be deployed.
“We’re already a distributed database, and we have a variety of platforms on which we’re interoperable,” says Krafft. “So it lends us very well to being ‘cloud-ready.’ We already have the ability to install Infinite Graph in most virtualized cloud platforms – Amazon EC2, GoGrid, RightScale – and we’ll be producing some tips and tricks on our developer wiki that show people how to build the components in their applications that can exploit the EC2 and GoGrid APIs, allowing them to auto-provision and turn on resources as needed, as their data grows or ebbs. It’s up to the developer to put us into the images they use on their own preferred cloud platform.”