Mobile analytics company Flurry has been tracking the progression of iOS and Android application penetration across the world. No surprise, the United States is the most mature smartphone market on the planet. The rest of the world is catching up. China and South Korea both have made great leaps in 2011 to bring smart devices to users and where there is a smartphone, there is an app for that.
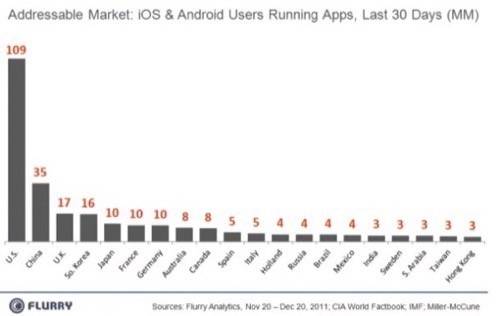
The U.S. has the highest install base of Android and iOS devices running apps in the world at 109 million. China is second at 35 million with the United Kingdom third at 17 million. The mobile app market is by no means saturated. Flurry still sees lots of room for it to grow.
Flurry tracks 140,000 apps across Android and iOS devices worldwide. The snapshot of what the company calls the “addressable market” – people not yet using Android or iOS apps – was taken during the last 30 days. Flurry is only counting phones currently in use, skirting the numbers that Apple and Google has said they have sold to date that have been replaced by new models.
Flurry encourages app developers to look overseas for potential growth markets. For instance, in China there are 122 million middle class adults age 15-64 that are not using iOS or Android. In the U.S. that number is 91 million (figuring a 200 million potential smartphone user base or about 60% of the population).
This brings us to the “addressable market.” Right now, the most mature markets are the ones that have the highest penetration per, population. That means that the U.S., Sweden, Hong Kong and Sweden are the most mature. At the same time, the U.S. still has lots of potential to grow in iOS and Android adoption. Take a look at the chart below.
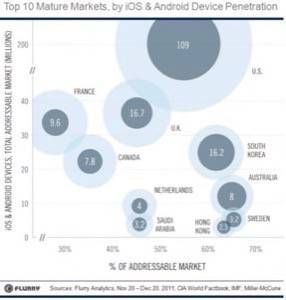
This chart is a little confusing if you do not know exactly what you are looking at. Here is the explanation from Flurry:
The vertical axis measures our total addressable audience (TAM), which we define as adults, 15 – 64, who are at least middle-class. The TAM per country is represented by the larger, light blue circles. The U.S., with the largest light blue circle, has the largest TAM at 200 million. The horizontal axis shows percent penetration, which is the active user (iOS or Android device that used an app over the last 30 days) divided by the TAM
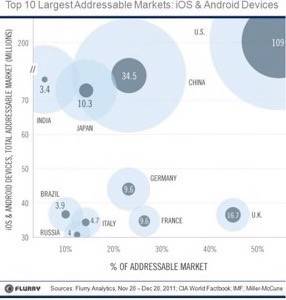
.Now that we have a look at the mature markets, which ones have the most potential? The light blue portions of the circles show the potential for the apps ecosystem to grow. In this chart, the U.S., Japan, China and India have the highest potential. Sweden and Hong Kong drop right off the map.
Expect developers to start focusing on more emerging markets in 2012. The U.S. may be the test bed for popular apps, but there is big money to be made overseas. Is your studio planning on taking advantage? Let us know in the comments.