In mobile ad network Millennial Media’s March 2011 report on mobile platform trends, it found that iOS’s share has grown, thanks to the recent launch of the Verizon iPhone. Month-over-month, the iPhone grew 17% and the iOS platform itself grew by 11%. The Verizon iPhone accounted for 8.2% of all the iPhone impressions on its network during March, says Millennial.

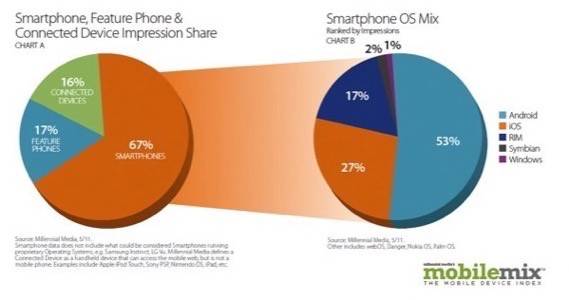
Meanwhile, Android was the leading smartphone platform on the network for the 4th month in a row, with a 48% ad impression share. However, in terms of impression growth, as opposed to share, Apple iOS impressions grew at 29% while Android impressions grew 23%.
Also of note, 14 of the top 20 devices on Millennial’s report run Android. The top five, in order, were the iPhone, the BlackBerry Curve, the HTC Evo, the Samsung Bolt and the BlackBerry Bold 2.
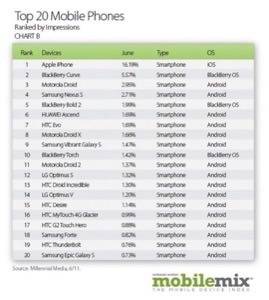
The top 5 manufacturers were Apple, Samsung, HTC, RIM and Motorola.

Connected Devices Growing
Millennial doesn’t just track smartphones, though. It looks at other “connected” devices, too, including the iPad, iPod Touch and Samsung Galaxy Tab, for example. This group increased 21% month-over-month, now accounting for 17% of the total device impression share. Smartphones were at 64% and feature phones were at 19%. The feature phone share number shouldn’t be taken as indicative of wider market share trends, however, because Millennial’s ads can’t even run on what’s still a very large portion of the mobile phone market – the “dumb” devices without apps or browsers known as “feature phones.”
Revenue Share
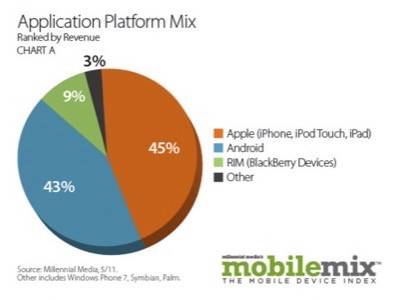
Developers, of course, will be most interested in the data on revenue share. iOS apps represented 47% of the Application Platform Mix, when ranked by revenue. Android apps were 36%, BlackBerry apps were 7% and “Other,” a category that included Nokia’s Symbian, Windows Phone and Palm, were at 10%. This trend is more indicative of Millennial’s customers, however, than it may be of general revenue trends on various platforms.
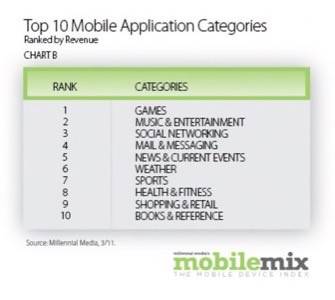
That said, Millennial found that gaming applications were the number one app category last month, with 37% of the app revenue share. Shopping and Retail apps also grew by 40% month-over-month. Ranked by revenue, the top categories in March were games, music and entertainment, social networking, mail and messaging, news and current events, weather, sports, health and fitness, shopping and retail and finally, books and reference.
