By the time you read this today, the BP/Transocean/Halliburton oil hemorrhage may finally be on its way to a resolution. Or it may still be burbling away, happily coating wildlife, habitat and the region’s tourism and fishing industries with a viscous sheen of Game Over.

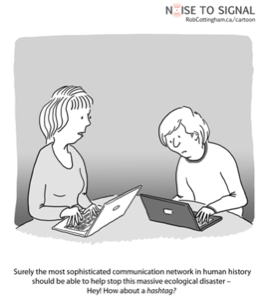
A lot of us have taken to our networks to fulminate over this without a lot of focus or hope of affecting things – me included. Of course, sometimes you just have to vent (as a certain large, gaping opening in a BP oil pipe could tell you). And raising awareness is a Good Thing.
But some folks are taking it beyond just a few retweets, and using online tools to genuinely contribute to our understanding of the disaster. Take Paul Rademacher’s use of Google Earth to map the extent of the oil spill onto any location on Earth – say, your own hometown – and gain a sense of the geographical scope of the situation. (It’s possible, in turn, because of Google’s impressive crisis response page for the spill, which has a collection of mapping layers and resources.)
Or look at Oil Reporter, an open-source app for the iPhone and Android that lets ordinary people log individual instances of oil spill impacts they discover – crowdsourcing the documentation of the spill’s effects, Ushahidi-style. It’s created by the good people at CrisisCommons, which has partnered with the San Diego State University Visualization Center to manage the data collected through the app – which is available through an open API.
That hasn’t meant one less drop of oil has come out of that pipe. But these two initiatives, and others like them, can help buttress support for spending the billions that will be needed to do what can be done to clean up the aftermath, and in the case of Oil Reporter, help point out places some of those resources should go.
And with any luck, it could spur some people like me who’ve confined our activism to subscribing to the BPGlobalPR Twitter feed (which is often funny as all hell) to do something a little more meaningful.


