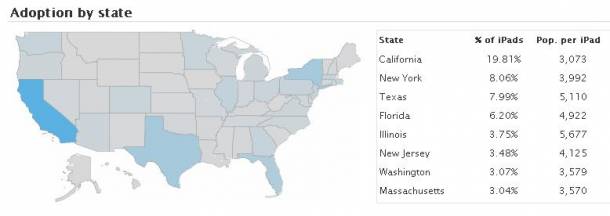
Now that we’ve finally embarked on a future of tablet computing (didn’t we do that ten years ago?) with the iPad, we immediately got to wondering: What does iPad adoption look like across the country? Luckily, online ad network Chitika has offered some numbers on what its seeing for iPads broken down over time and state by state.

Chitika took a look at where and when it was seeing hits from iPads and built a real-time page to show you what’s going on with the release of the latest and greatest in Internet gadgetry.
According to Chitika, there are just around 300,000 iPads now in the wild, a number that jives pretty well with Apple’s own estimate. Of those, 22% were first seen by Chitika today, with just under 100,000 hitting the open Internet on Saturday, the iPad’s release date.

Looking at the map of iPad adoption, the company quickly declares that “it looks like California is running away with the title of ‘iPadest State in America,’ with more than double the iPads of any other single state” but we content that the District of Columbia has the highest concentration of iPads by far, with one iPad for every 2,019 people. Following the District of Columbia are Hawaii, with one for every 2,785, and Nevada, with one for every 2,901. Rounding out the very bottom of the list are Iowa, with one for every 29,489, and Montana, with one for every 27,857 people.
Looking purely at the number of iPads, however, California leads with nearly 20%, New York follows with 8%, Texas with just under 8% and Florida with 6%.
Again, on percentages, the three states where you are least likely to see an iPad in the wild? Wyoming, North Dakota and Montana, all with less than 2% of all iPads combined.
To keep track of how the iPad dispersion plays out, check out Chitika’s real-time numbers. The company’s methodology is detailed in its blog.


