Sébastien Pierre is the founder of FFunction, a Montréal-based data visualization company. His company created an infographic titled: “What is Data Visualization?”

We asked Pierre for an explanation about the infographic and how it defines data visualization.
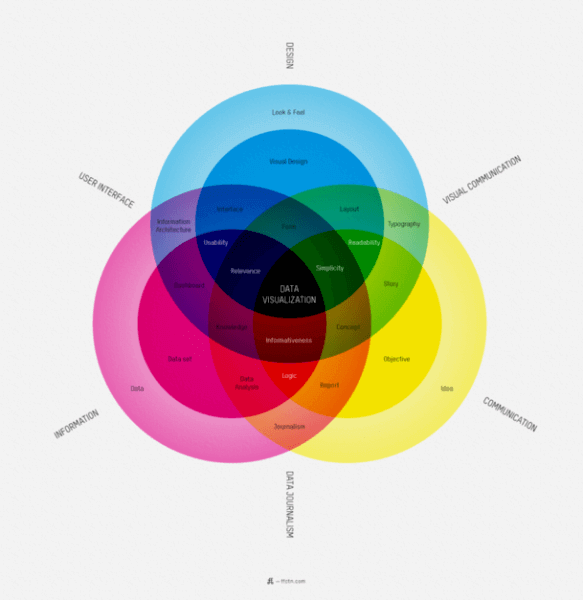
According to Pierre, definitions for the terms in the infographic are as follows:
- Fields: Design, Communication, Information and their mix: Visual Communication, Data journalism, User Interface
- Raw elements: Look & Feel, Idea, Data
- Disciplines: Journalism, Information Architecture, Typography
- Process elements: Visual Design, Objective, Dataset
- Outputs: Layout, Story, Report, Data Analysis, Dashboard, Interface
- Final result: Form, Concept, Knowledge
- Core competencies: Readability, Logic, Usability
- Core values: Simplicity, Informativeness, Relevance
Data visualization starts with being a journalist to some extent, Pierre said. You need to find the data and analyze it. This discovery process means finding data sets that are of good quality and up to date.
It’s also about information and communication, Pierre said. Visualization should reveal hidden patterns and trends within the data. It should explore a topic, help make a discovery or tell a story. Whatever the goal, you have to turn the data into information that people can understand.
Once the information and direction are defined, the visualization itself needs to be formalized.
Pierre:
“Will it be interactive or static? Will it be used as a tool or to illustrate something? Depending on how we position the visualization, it will be more demanding on UI aspects or on visual aspects. Dashboards, online reports and interactive web visualizations need a solid understanding of UI design, while infographics and print reports require a strong foundation of typography, layout and visual communication.”
The design ties it all together. It makes the visualization appealing and interesting. The design must balance the simple and the complex. The data visualization needs to communicate the complexity of the information without losing its richness or depth.
Data visualization requires expertise from multiple disciplines. It mixes different perspectives. It is what Pierre and his group built into this infographic. The art of developing infographics with big data draws from the world of print journalism, statistical analysis and the graphic arts. It will continue to rely on these established disciplines. The difference will be accessibility. More people will have access to tools and the knowledge needed to create infographics that simply communicate complex concepts while also maintaining a richness that helps express a deeper meaning.