As part of our “Never Mind the Valley” series here, we often feature communities outside the Silicon Valley that have become thriving centers for entrepreneurship. We’ve profiled cities like Boston, Montreal, and Austin.
Sometimes we notice there’s a flurry of startup activity in a particular location that warrants coverage, and sometimes we’re pitched stories about these locations. (And you should feel free to pitch us as to why your city should be featured, particularly if you’re outside the U.S.) But as great as these sources for stories are, neither offer any sort of scientific method for pointing to the cities that are the best locations for startups.
In a blog post yesterday, VC Brad Feld wrote about the “entrepreneurial density” of Boulder, a city often noted as being a startup hotbed. He writes,
“Entrepreneurial density isn’t just the “number of entrepreneurs per capita”, but it’s the “number of people that work at entrepreneurial companies per capita.” It gets even bigger when you include students and calculate the “(number of people that work at entrepreneurial companies + the number of students) per capita. As ED = ((entrepreneurial_emps + students) / adults) approaches 1, you get complete entrepreneurial saturation. I’m going to guess that Boulder’s Entrepreneurial Density using this equation is somewhere between 0.50 and 0.75, but this is just a guess. I’m curious if anyone out there has a real way to calculate this.”
Responding to the challenge is Pete Warden, who has used Crunchbase and US Census data to provide an answer.
According to Warden’s figures, the top zip codes for money raised per person are:
CA 94104 – $629m total – $1,681,925 per person
CA 94304 – $2,822m total – $1,656,031 per person
CA 94105 – $972m total – $472,540 per person
MA 02142 – $1,013m total – $448,833 per person
IL 60606 – $739m total – $439,744 per person
And the top zip codes for company per person are:
CA 94104 – 87 companies – 0.233 per person
CA 94105 – 173 companies – 0.084 per person
CA 95113 – 24 companies – 0.044 per person
MA 02142 – 73 companies – 0.032 per person
MA 02210 – 19 companies – 0.032 per person
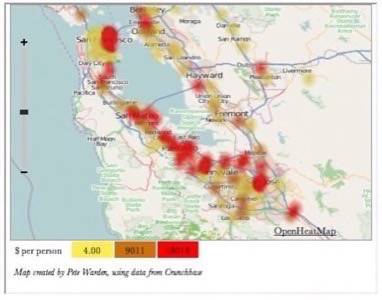
Using his OpenHeatMap tool, there are, of course, maps of the information. And Warden has open-sourced the code and the data so that others can work with it.
Warden admits that it’s a “crude approach,” but nevertheless, it’s interesting to see how the numbers may or may not patch our perceptions of entrepreneurial hot spots.