When we look at a city in terms of a map, the map we most often use, whether paper or online, is a street map. Street maps tend to divide things according to political considerations. The city itself, the county it’s in, maybe the neighborhood or borough. Streets change in character and function but most maps fail to express that change.
But now, using Flickr and OpenStreetMap, Eric Fischer has created a series of maps that look at cities in a much different way. According to race and ethnicity.
This is not the first unusual data-based map that Fischer, an Oakland-based programmer, has created. Among others were a series of 81 city maps that defined tourist and local spots based on geolocation data and duration of posting in the city.
In this one, Fischer was inspired by Bill Rankin’s racial survey of Chicago. To create his series of 102 maps of American cities, Fischer used data from the 2000 United States Census report.
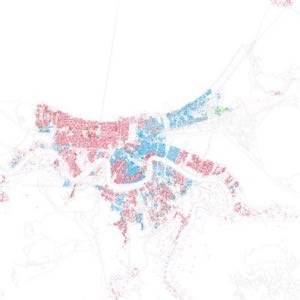
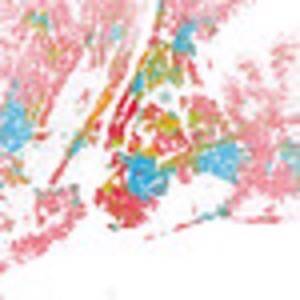
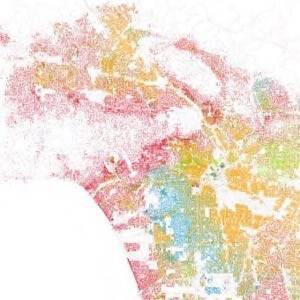
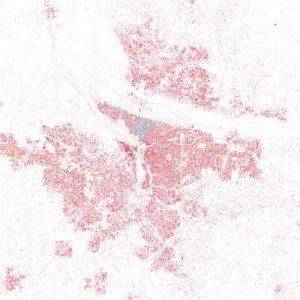
In keeping with Rankin’s map, he assigned red to white folks, blue to black, green to Asian, orange to Hispanic and gray to “other.” Each dot represents 25 people.
The core areas where different types of people have congregated over time are obvious. But what is also obvious – something that people in a city know and maps don’t – is how complex are the interplay of those areas and the shading of the borders. A rainbow is a bit of a mawkish symbol for the multiracial nature of the U.S. but looking at Fischer’s maps, it’s also an accurate one.
But that rainbow is narrow, according to Fischer.
“The maps of race are . . . maps of discomfort, in a much more long-term kind of way: of vast areas where people of certain races apparently do not want to live or are prevented from living. It’s a fairly distressing thing to map because it’s much more pleasant to find out where people are comfortable than where they are uncomfortable.”
Los Angeles
Portland
New Orleans