There are a number of questions people ask when looking for a new place to live: What are the schools like? How close is public transportation? Are there grocery stores nearby? But one of the most common concerns is safety. People want to know about the crime rates in cities and neighborhoods.

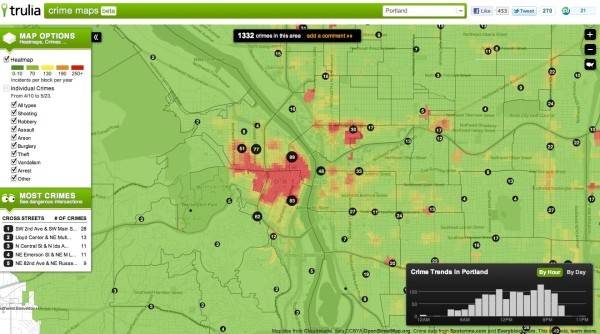
The real-estate Trulia launched a new product today called Crime Maps that should answer some of these questions. As the name suggests, the new tool lets people view and compare the frequency, types, and history of crimes across various cities in the U.S.
The data for Crime Maps comes from a number of sources, including CrimeReports.com and EveryBlock, which in turn work with numerous news and law enforcement agencies to gather crime data.
Crime Maps users can drill down into the crimes in specific neighborhoods and can easily compare statistics between different locations. The tool generates a heatmap so you can identify and differentiate high-crime and low-crime areas at a glance. Crimes are also broken down by time of day and by type – all helpful as you weigh whether you want to live in a neighborhood that has a propensity towards shootings or vandalism. The tool also lets you add information and advice so you can add your own comments on top of Trulia’s data.

“Historically, detailed and easy-to-decipher crime reports haven’t been easily accessible to the average citizen, and Trulia aims to bring that data to light at the most important moment – when people are deciding where they should live,” says Pete Flint, Trulia’s co-founder and CEO.
It makes good business sense for Trulia to be able to add this sort of data to its search offerings as this sort of hyperlocal is increasingly important. However, at launch, Crime Maps are only available in 50 counties.


