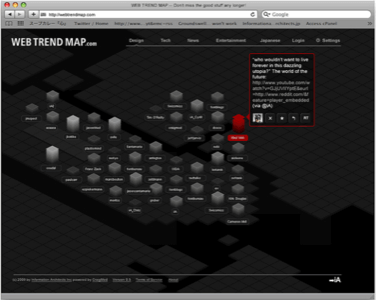
UPDATE: According to a recent iA Twitter update the interactive Web Trend Map 4 will open for beta testers tomorrow if it can solve some server problems.

We were very excited earlier this year when RWW made its way onto the latest edition of the Web Trend Map. For those of you unfamiliar with this map, it “plots the Internet’s leading names and domains onto the Tokyo Metro map. Domains and personalities are carefully selected through dialogue with map enthusiasts, and every domain is evaluated based on traffic, revenue, and character”. Information architecture company iA built this awesome visualization and we have learned that it is about to roll out an interactive version of its map later this month.
Thanks to a tip from RWW reader @CleverClogs, we discovered that Tokyo based iA, who has been working on an interactive version of its Web Trend Map 4 since early June, will launch on July 14th. According to iA, “the idea is simple: Track the online tends in real time, deliver them in personalized and localized isometric maps. The technology is kind of a complicated story; but of course, we’ll give our best to make the interface as simple as the idea”.
No further details were given at press time, but we did find another clue on the company’s Flickr photostream; “July 14th is the launch day of the interactive Webtrendmap. I hope we can launch the new iA site at the same time…our website might look somewhat like this (WTM spoiler alert)”:

You can already go to openzoom.org to find a zoomable version or go here to order a full-size printed version. Be sure to follow @iA on Twitter and check out the notebook on its blog for any breaking news updates about its visualizations.
This news tip was submitted by a RWW reader. If you discover any Web apps, Web technology trends, social media or social networking tips you think might be interesting for us to write about, please send them to us at [email protected].


