A group of hackademics took the Wikileaks activity data from the Afghanistan war and mapped it, creating a video visualization of the events. The 91,000 documents track events including friendly fire and civilian injuries and death over the course of the last six years.
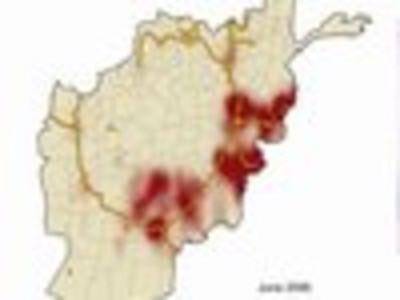
According to Mike Dewar, a post-doc student at Columbia University’s School of Engineering, the heatmap, which runs at ten days per second, was based on the “number of events logged in a small region of the map over a 1 month window.”
“The intensity of the heatmap represents the number of events logged. The colour range is from 0 to 60+ events over a one month window. We cap the colour range at 60 events so that low intensity activity involving just a handful of events can be seen – in lots of cases there are many more than 60 events in one particular region.”
In addition to Dewar, the map was created by Drew Conway, a PhD student in Politics at NYU, John Myles White, a PhD candidate in Psychology at Princeton and Harlan Harris, a statistical programmer Kaplan Test Prep. The group wrote the code as part of the New York August bit.ly hackathon. The code the group wrote to make the heatmap animation is available at github.
This group’s isn’t the only data visualization to result from the Wikileaks release. Which ones have you seen that have affected you in a particular way, have illustrated a heretofore illusive reality of the war or otherwise helped you clarify an aspect of this conflict? Let us know in the comments.
Visualisation of Activity in Afghanistan using the Wikileaks data from Mike Dewar on Vimeo.