Wikipedia is one of the most popular and highly-trafficked websites in the world, with over 3.6 million content pages. While much of the discussion around Wikipedia involves those using the site for research, it’s always worth noting – and praising – the tens of thousands of volunteers who actively contribute and edit the content. In fact, according to Wikipedia, there have been some 463 million edits to the site – roughly 19 edits per page.

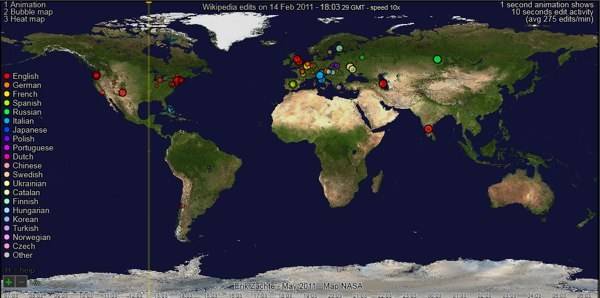
Wikimedia’s data analyst Erik Zachte has just unveiled a new visualization that shows exactly where in the world these edits are occurring on any given day for the various language editions of Wikipedia.

The visualization is interactive and using various keyboard shortcuts, you can navigate between different views and event markers. You can zoom into a particular area (with the + key), for example, or filter the edits by language (with the space bar).
There are three types of visualizations available with this new tool: an animation of edits, a bubble map, and a heat map – all highlighting the 400,000 some odd edits that occur in a given day.
The tool reveals some interesting trends, not surprisingly showing different language versions more active depending on the time-zones. It also demonstrates that most edits to the Chinese-language Wikipedia come from outside mainland China.

Zachte has written a blog post explaining how he created the visualization tool using HTML5 and JavaScript.


