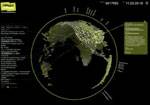
Over the past couple of days we’ve had two in-depth posts on the theme of visualization. This is one of our trends to watch this year; and so these posts are well worth your time reading (and viewing!). Marshall Kirkpatrick wrote User Interfaces Rapidly Adjusting to Information Overload and Sarah Perez wrote The Best Tools for Visualization. The winning comment is from Sarah’s post and is from Anton of twingly.com. Anton pointed to his app, a screensaver that is a visualization of the blogosphere as a world globe.

Congratulations Anton, you’ve won a $30 Amazon voucher – courtesy of our competition sponsors AdaptiveBlue and their Netflix Queue Widget.
Here is Anton’s comment, followed by a video of his app.
“Our screensaver is a visualization of the real time web… more precise a visualization over the blogosphere, real time, as a world globe.
Read more about it here, and look at the Youtube-movie:
http://www.twingly.com/ScreenSaver.aspx
I think it’s worth to mentioning!”


