The Guardian has a great story today about how to be a data journalist. It’s a timely post. The forces that drive online law enforcement are increasing. It’s affecting the world of cloud computing and the open Web.

The FBI is telling us that they need access to encrypted messages. They want peer-to-peer technology to be outlawed. It’s centralization that they desire, not the chaos of an increasingly fragmented world.
But who is responsible for watching the FBI?
It’s really all of us.
The counterforce is the increasing amount of data available and our ability to access it. Data journalists can shine more sunshine on government than ever before. By explaining and showing what the data means, we can help balance the increasing efforts by the FBI and the Obama Administration to push through technology legislation that would mean onerous requirements for service providers.
The Guardian is a leader in showing people how to do data journalism. The tools they use and the data itself are products of the cloud. The Guardian’s examples help illustrate the ways we can explain complex events such as the conflict in Afghanistan or in examining data from law enforcement organizations such as the FBI.
Wikileaks: Afghanistan
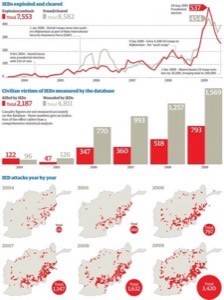
The Guardian put its data journalism techniques to work with the Wikileaks data they received. It included more than 92,000 rows of data.
They built a simple database to search for keywords or events. Through this they generated three key findings:
Improvised Explosive Device (IED) attacks over time
Where they happened by region
Casualties data recorded in the database
This was the result:

How to Do Your Own Data Journalism
That’s international, data-driven reporting at its best. The Guardian is a leader in this field. They are also a leader to show how people can do the same world class work themselves.
Guardian data journalism teacher Paul Bradshaw makes a point that we all face. The amount of data out there is massive. But with the tools available, that data is easler to tackle.
In addition, we have seen over the past several years a convergence of investigative research, statistics, design and programming.
We can’t be experts in all these disciplines. But we can all play a role in what The Guardian outlines as four main parts:
Finding the data. Doing research through Twitter, aggregating RSS feeds or using progamming languages such as MySQL or Python to gather the data.
Interrogating the data. Knowing the jargon can be important to understanding the context of the data.
Visualizing the data. Bradshaw writes: “Visualising and mashing data has historically been the responsibility of designers and coders, but an increasing number of people with editorial backgrounds are trying their hand at both – partly because of a widening awareness of what is possible, and partly because of a lowering of the barriers to experimenting with them.”
Mashing it up. Aggregating data from different sourcees and viusualizing it through applications like ManyEyes. Yahoo! Pipes is an application used to aggregate RSS feeds.
More Tools
The remainder of the post goes on to describe the ways tools can be used to do online journalism. We’ll follow up with another post about these tools and how they are being used.
Data journalism seems very relevant in this day and age. More than ever, we need ways to observe and illuminate what is happening, especially as concerns over security and safety have the potential to override the free flow of information that makes the Internet and the cloud so important to society.


