You have to be able to tell a good story. I mean that as a general rule. (i’m a folklorist after all, right?)

But when you’re an entrepreneur, it’s particularly important that you can craft a story to share with others, one that really encapsulates what you do and why you do it. Your audience could be a customer, investor, journalist, colleague, friend, and you need to be ready to be imaginative, memorable, strategic.
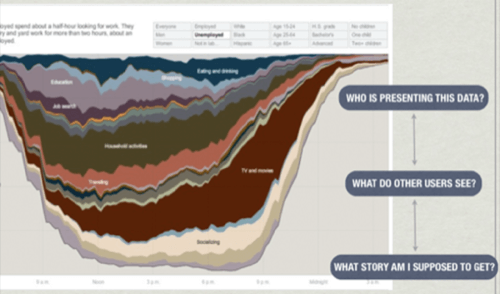
Storytelling doesn’t simply involve being a wordsmith (although that helps). We have at our disposal now a wealth of data that we can enlist in the service of making a compelling tale or a convincing argument. To that end, “Telling Stories with Data” was the subject of a recent workshop at VisWeek 2010 and Flowing Data has a recap of the presenters’ talks.
Use Data to Help Tell Your Story
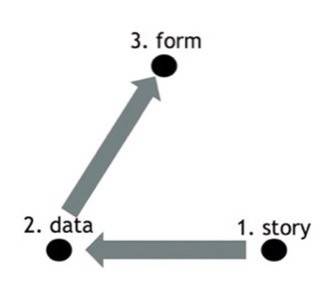
Even if we are using data and visualization, we do still need to consider the stories we want to tell. In Jérôme Cukier’s presentation, he argued that when he writes for OECD factblog, “his goal in creating a given blog post is to capture the interest of the reader within 10 seconds.” Visualizations can be key in doing that. And then, “like a journalist, his approach is to start with the story he believes is in the data, rather than performing analysis to find stories. Once he has a story in mind, he deliberately limits the data he visualizes to create a simple, coherent story.”

In other words, you don’t present data for the sake of data. Data doesn’t necessarily speak for itself. You need to use the data for the story you want to tell.

While many of the panelists at the “Telling Stories with Data” workshop spoke about interactive visualizations, the emphasis was on designing interactivity to assist with storytelling, whether open-ended and exploratory or whether driven to a particular end.
The “Hockey Stick” is a Great Story, Don’t Get Me Wrong…
The “hockey stick” is a pretty familiar visualization for startups. It is meant to tell the story of rapid, exponential growth. We know the story. We know the image. And while it’s impressive (and probably still an argument you want to make to investors), there may be other ways in which you can visualize your startup’s potential. There are other characters and other events that you can show while still telling your startup’s story.
In the conclusion of the post on Flowing Data, guest author Joan DiMicco writes, “storytelling with data has the potential to promote increasingly sophisticated and data-literate conversations in the world at large.” And while I’d argue that being a good storyteller will help keep your startup appealing, mastering some of the new tools for data visualization may help make your startup not just interesting, but relevant.
Images from Telling Stories with Data 2010 and from Lascaux, approx 15000 BC


