We swim in a world full of data. Every time we play a mobile game and swipe a piece of fruit, shoot a bad guy, fling a furious fowl at a pen of swine or tap an ad, data is being created. Over the days and weeks that data adds up to the point where we can break it down into larger trends and take a full look at the landscape that has been created.

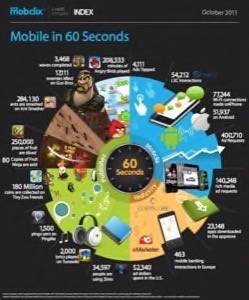
That is the macrocosm view. What about the microcosm? How much data are we producing per minute? We found an old infographic from mobile advertising company Mobclix that shows just just how much data we are creating each minute when using our mobile devices. Check it out below.
I have a friend that is obsessed with Fruit Ninja. His high score is somewhere near 830, which is apparently really high. Not long ago, I handed him a Kindle Fire and he went to town, cutting fruit at a vicious pace that left others in awe of his super-ninja powers. In one minute-long game, my friend contributes about 0.00332% of fruit sliced in Fruit Ninja.
In that minute, 4,111 ads were clicked in Mobclix’s network. That translates to 400,710 ad requests. The click-through rate of mobile ads does not appear to be very healthy. Those clicks amount to $2,340 dollars spent by advertisers in the U.S. per minute.
App downloads have been growing exponentially in the last few months. In October the App Store saw 23,148 downloads per minute.
Check out the infographic below.


