Mobile analytics firm Distimo has just released its year-end report summarizing the figures, statistics and changes which occurred in the mobile application ecosystem during the course of 2010. The report looks at the major mobile platforms of the day, including iOS (iPhone and iPad), Android, BlackBerry, Nokia, Palm and Windows (6.x and Windows Phone 7).
Some of its findings are more obvious than others (e.g., free apps are downloaded in higher numbers than paid apps), but other tidbits of data may give developers pause as they consider how best to monetize their mobile applications. For example, developers may be surprised to hear that the revenue earned from in-app purchases within high grossing free apps more than doubled during the 2010, suggesting a new trend in app monetization.
Growth by the Numbers
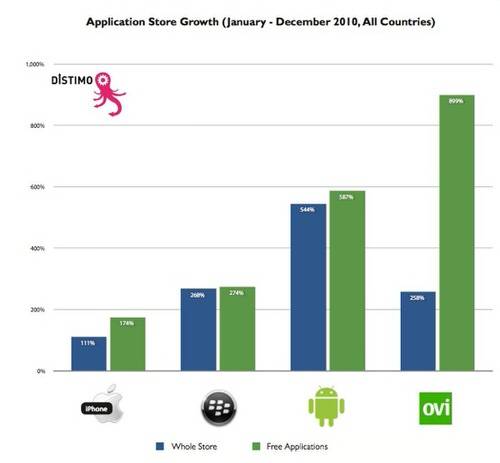
In looking at the absolute number of applications, Apple’s App Store grew the most in 2010, doubling its last-year’s total to almost 300,000 apps by year-end (excluding the iPad store). But in terms of percentages, the runners-up did better. Google’s Android Market is now 6 times the size it was last year. (For what it’s worth, Distimo pegs that size at 130,000 applications, although the third-party application monitoring service at AndroLib.com found there to be 200,000 earlier in December. This number was widely reported, often without noting that AndroLib counts everything, even apps that are no longer on the Market.)
RIM’s BlackBerry App World and Nokia’s Ovi Store also tripled their growth over the year, growing to 18,000 apps on BlackBerry App World and 25,000 apps on Ovi.
Free vs. Paid
Obviously, free apps do well in terms of downloads. Says Distimo, the high download volume has convinced many developers to switch monetization methods from paid to something else.
The number of free apps in Apple’s App Store (for iPhone) and Nokia’s Ovi Store both skyrocketed in 2010, but the extreme difference in Ovi’s case may be attributed to the unavailability of operator billing in a number of Nokia’s markets.
Download Volume
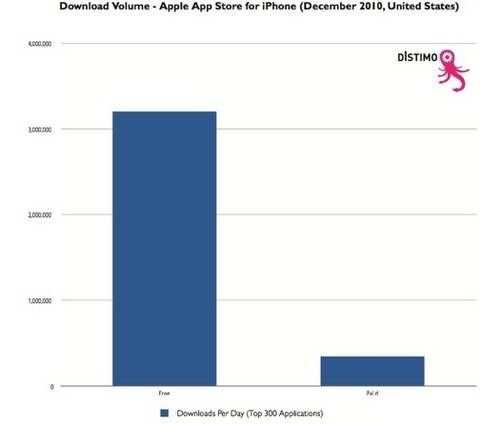
In the U.S., the top 300 free apps generated over 3 million downloads each day during December 2010, while only 350,000 paid apps were downloaded daily. However, those paid app download numbers still represent a 30% increase from June 2010. (Data excluded downloads after Christmas, to obtain a more “normal” view of the numbers).
In-App Purchases
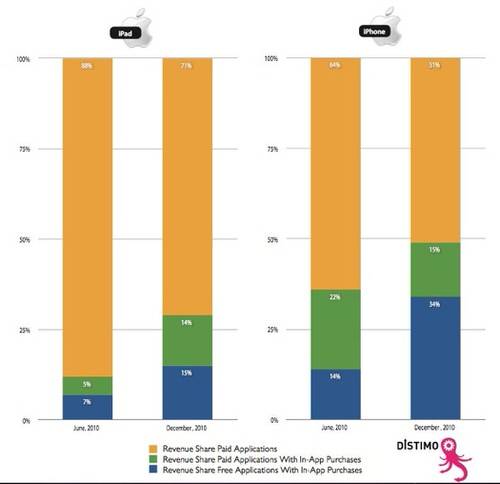
The share of revenue generated by in-app purchases climbed steadily over the course of the year, says Distimo. Also, when comparing June to December, the share of revenue generated by in-app purchases more than doubled on both iPhone and iPad. However, in-app revenue is smaller on iPad (15%) than iPhone (34%).
Average App Prices
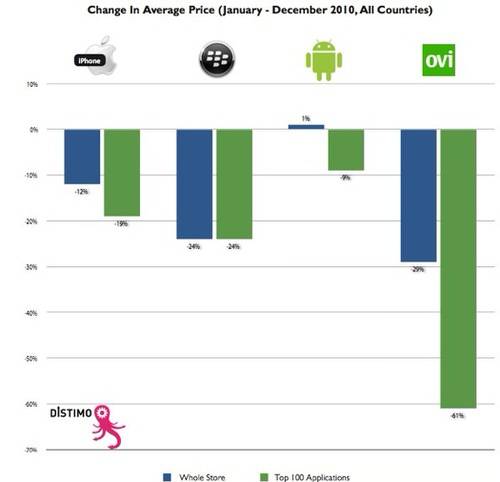
The average price of paid apps on the four top platforms (iPhone, BlackBerry, Android, Nokia) declined in 2010. Distimo found that price drops could be observed in the 100 most popular applications, even though the percentages differed. With the exception of the Android Market, the average listing price is lower now than it was in January 2010.
The average price between all apps and just the top apps shows slightly different trends, however. On BlackBerry, the price of top apps is significantly lower than all paid apps, something which is also happening to a lesser extent in the Apple App Store (for iPhone). In Google’s Android Market and Nokia’s Ovi Store, the top apps are more expensive than the average price for all paid applications.
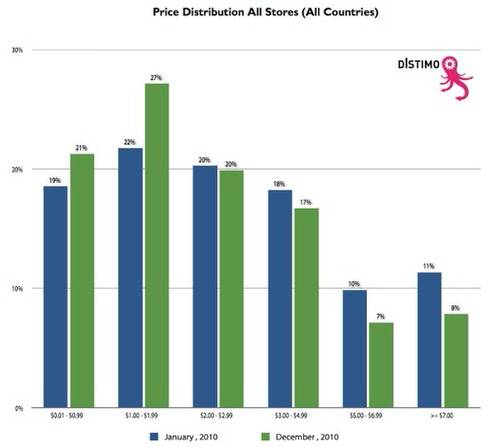
As 2010 progressed, all four stores became more in line with each other. Here, there was a shift towards the lower price tiers where the $1.00-$1.99 tier gained popularity across the board.
Growth Categories per Store
Distimo noticed that during 2010, there were more business-oriented applications available for iPhone, reflecting the switch occurring in many workplaces where employees are now allowed to use the iPhone instead of whatever mobile phone the company’s I.T. department had previously recommended or enforced. Outside of the workplace, more people are using the iPhone as a productivity tool.
Meanwhile, the business-friendly BlackBerry platform saw its App World receiving more entertainment-focused applications, as it tries to shift in the other direction, towards being a more consumer-friendly product.
Android Market and Nokia’s Ovi Store saw more balanced category growth.
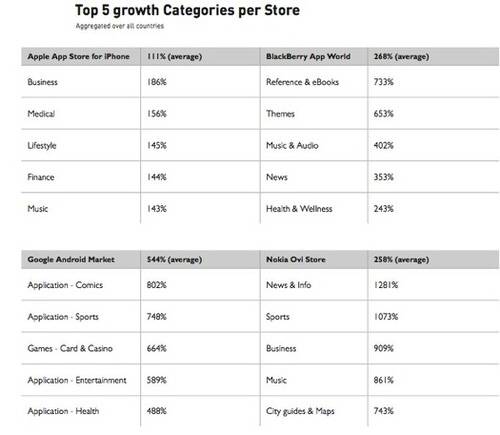
Note that Google’s Android Market introduced many new categories during the year, which is why Application-Health’s growth is lower than the average.
For more details on the rankings of individual applications per platform, you can see Distimo’s report here.
