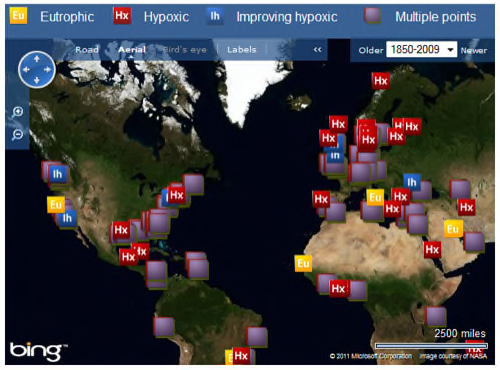
The World Resources Institute and the Virginia Institute of Marine Sciences have teamed to create an interactive map of eutrophication and hypoxia in the world’s coastal areas.

There are 530 areas identified as suffering from low oxygen – that’s hypoxia – and 228 more suffering eutrophication, or excessive fertilization, usually from run-off. Identifying problem spots is job one for anyone hoping to slow, stop or reverse these sorts of marine declines.
Added together, the affected areas total 95,000 square miles, the size of our founding editor‘s homeland. Unsurprisingly, the biggest dead zone is at the mouth of the Mississippi and covers 8,500 square miles, the size of New Jersey. (There’s a joke there. I’m not up to it.)
The last several years have seen a real upsurge in the mapping our natural and social resource concerns. Although the things the scientists and citizens have been mapping are discouraging, the fact they are recording, visualizing and sharing them leaves room for hope.
Mindy Selman, senior water quality analyst at WRI, agrees.
“Until now, a lack of information and monitoring has been a major impediment to understanding the extent and impacts of ‘dead zones’ and eutrophication in coastal ecosystems. This website is an important step forward because it compiles the current information into a central location to raise awareness and offer solutions for controlling nutrient pollution.”
A 2007 study by the World Resources Institute indicated the largest impediment to fixing dead zones was lack of public awareness. Its administrators hope this project helps to address that lack. But they also hope the project, as befits the online media it employs, will act to gather missing information from lay-readers and scientific professionals alike globally. So take a look. If they’re missing something, speak up.
The interactive map is only one aspect of the website, which is being described as a “‘one-stop shop’ that provides a global database and interactive map of affected areas, as well as links to articles, photos, and other resources.”
The site also provides tools, like catchment and nitrogen calculators; a resource library of articles and websites; and a map-keyed regional resource listing.
I hope they provide a larger format map, as the one on the site, though navigable, is a bit close. It might also be interesting to consider releasing an API of the project to see what independent scientists, conservation groups and citizens could add to it.
Read ReadWriteWeb coverage of mapping the economic and legal effects of the BP spill in the Gulf of Mexico and other geolocation issues.