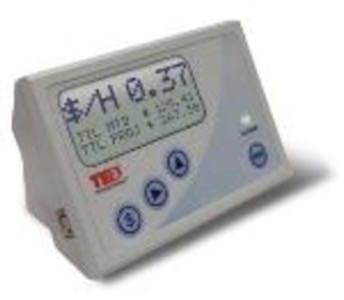
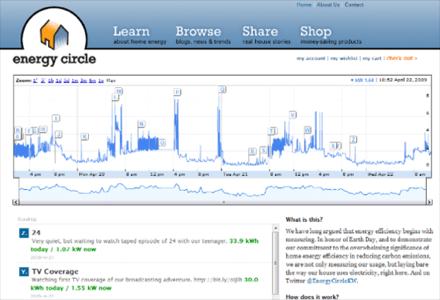
Peter Troast, founder of Energy Circle, a company that sells energy-saving products, has created a new energy-monitoring system that sends his home’s energy usage stats to Twitter. Inspired by the open source power monitoring kit from Tweet-a-Watt, Troast’s system also sends his home’s energy data to the web, but it’s not in the form of once-a-day tweets like Tweet-a-Watt provides. Instead, his system uses a monitoring device called TED (The Energy Dectective) to create charts which are annotated by family members then tweeted for everyone to see. If you want to do the same for your home, we’ve got the info.

Just in time for Earth Day, Troast hooked up a TED device to the junction box in his basement and rigged it to transmit data to the net. That real-time data can be viewed online at www.energycircle.com/ted_display/. By using Google’s Visualization API, he was able to create a graph from the data source that’s connected to the web. In this case, that’s the TED energy-monitoring device. As there are spikes and dips in the graph, a family member annotates those occurrences and those notes are automatically tweeted to a special Twitter account at Twitter.com/EnergyCirclekw.

Since the Troasts started using the device six months ago, they’ve decreased their energy use by 15%. Now they’re wondering if it will drop even more with the world watching their energy consumption online.
Developers, Want to Make Your Home Tweet?
Although not everyone will want to make their data as public as the Troasts have, we know there are probably a few “do-it-yourselfer” developers who have been waiting for a fun project like this to at least hold them over until Google gets their PowerMeter rolling.
Non-developers, try the Tweet-a-Watt system, instead.
Here’s how to create your own real-time TED-tweeting home like the Troasts did:
Materials
- TED (The Energy Detective)
- ASUS WL 500G Deluxe wireless router
- OPEN Wrt operating System
- Google Visualization API
Methodology
- You’ll need a wireless router that has a USB Port and is capable of running an OPEN Wrt operating system. The Troasts went with the ASUS WL 500G Deluxe.
- Replace the router’s existing operating system with the OPEN Wrt operating system (Here’s how.)
- A customized script (customized software) has to then be put into the OPEN Wrt operating system. OK, so this is the hard part, Troast says the developers will post the script online at the EnergyCircle blog in a couple of days if there’s interest. So if you’re interested, please says so in the comments! Without this key piece of the pie, you’re left writing your own script. (And if you do, share!)
- Plug the TED into the wireless router using TED’s USB port.
- Write the ability to add an annotation to the data into the web site database so that you can annotate the data in the database.
- Write the data display page using the Google visualization API, which enables you to take the data and annotations and make a chart like the one that you see on the EnergyCircle site. (Specifically, they used the Annotated Time Line feature in Google’s visualization API).
Note – How the Data Streaming works:
- The script reads output from the TED every second and records it in a file located on the OPEN Wrt router.
- Each minute, the router posts the output into the Energy Circle Database.
About TED devices:


