“I wish I could make this flowchart look better” is a common complaint that pops up around ReadWriteWeb – and throughout offices around the world. So whether it’s mind maps, wireframes, or flowcharts, we’re always drawn to test new diagramming tools – just to see if they can help us create more aesthetically pleasing depictions of the concepts we’re trying to diagram. So you can only imagine our willingness to try a Web-based application called Lovely Charts.

Lovely Charts is a new diagramming application that focuses on making your charts look better. In our opinion, there are two keys to doing that: first, provide visually appealing icons and second, provide ways of making sure those icons are in alignment.
Lovely Charts delivers on both fronts. It offers a series of icons beyond the traditional circles and boxes. What’s more, because it’s built with Flash, all of those elements are easy to resize and manipulate. Lovely Charts also provides the alignment tools we’ve come to expect from desktop diagramming applications, allowing users to select multiple items and force them into proper alignment.
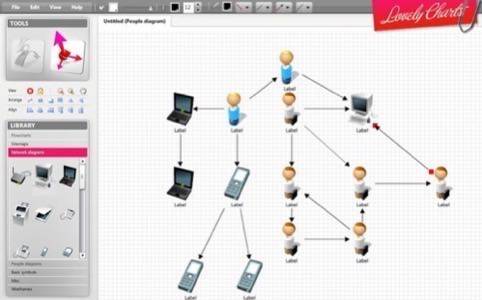
But that’s not all. Lovely Charts boasts a very intuitive composition mode, where users can easily clone items on the canvas by simply dragging and dropping them. The “Create & Connect” mode also provides a nice targeting feature that allows users to make sure the diagram lines are connecting the intended targets.
Lovely Charts was very easy to use. We were able to throw a diagram together – and a good looking diagram at that – in a matter of seconds. So easy, in fact, we were surprised that the demo lasted 15 minutes.
While we were pleased with the functionality of Lovely Charts, there was one particular issue that sullied our view of the tool. While the service boasts being 100% free, it’s actually a limited version of the application that’s free – one chart with limited options. If you need more charts, want to save revision history, or share them with anyone, you’re going to have to pay. What does that subscription buy? Plenty. Unlimited diagrams, collaboration features, the ability to share diagrams, version history, commenting, and email alerts of changes.

To be clear, we have absolutely no qualms with application developers charging for their services. That’s completely reasonable. What isn’t reasonable is being told the application is 100% free and then being asked to pay 29 to use the full application. That’s a bit off-putting. Which is too bad. Because we really liked the application.
Would we pay 29 a year to use the application? We might. It makes diagramming easy and the extended features seem well worth the price. We liked the application – just not the marketing of it.
Long story short, Lovely Charts is a simple and intuitive tool. If you don’t have a charting tool, it’s well worth taking Lovely Charts for a spin.