SocialNuggets is another sentiment analysis vendor, but they are trying to differentiate themselves by analyzing over a million social media conversations that they scan as part of their service. They have set their initial sites at the consumer electronics industry and have graphed some interesting changes to the market dynamics there. Here are a few graphs showing what they have learned, you can find more here.

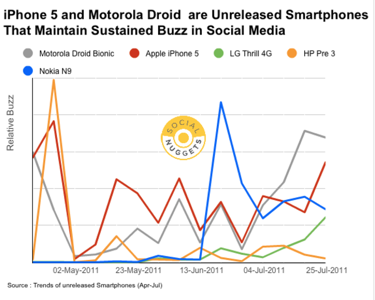
For example, here is a chart looking at social media buzz around the anticipated launch of new smartphones from April to July of this year. You can see that the iPhone v5 and the Droid Bionic are likely to capture some market share, because they can sustain their buzz over a period of months. While the vertical axis isn’t labeled (which annoys us to no end), you can see a fairly consistent buzz factor on the next iPhone. And an example of a phone that didn’t do well in the buzz department is the HP Pre 3, but of course this was before the big announcements earlier this week regarding WebOS and the subsequent tablet fire sales.
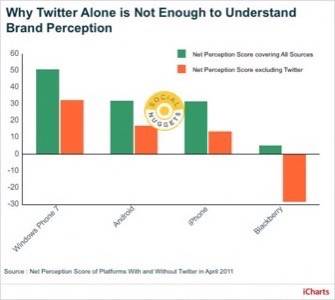
And here is another chart showing that looking just at Twitter data isn’t enough to understand perception of your brand. SocialNuggets compared perceptions from all of their sources and compared it to just Twitter, and you can see for some models, such as the Blackberry, the Tweets can be positive but overall the brand has a less positive perception because everything else is very negative.
(Again, whatever the vertical axis scale means, can’t really tell.) In each case, Twitter is just one data point that has importance, but shouldn’t be used exclusively.


There are a lot more charts to examine on their site with some interesting implications for marketing folks.


