If you’ve ever sat around mulling over different parts of an interactive map after an election or studied the New York Time’s “How Different Groups Spend Their Day” graph, then you know the value of a good chart. They can suck users in and really engage them. They can take a complex concept and make it simple.

Google’s latest release, the Google Chart Tools, will make it easier for sites to show their users data in a meaningful, visual and interactive manner.
These tools are broken down into two parts: image charts and interactive charts. The image charts work off a simple URL structure, defining all of the necessary characteristics through URL parameters. The interactive charts, while still relatively simple compared to custom creation, use a slightly more complicated Javascript library.
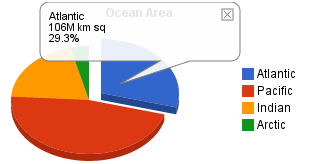
Interactive charts will allow for showing extra data on mouseovers and simple animation. There are 30 different chart styles available, from interactive maps to pie charts, line charts to Venn diagrams.
According to the Google Code Blog, “Interactive charts trigger events, providing tool-tips and animations. In addition to a rich gallery of charts, this tool can also read live data from a variety of data sources such as Oracle PL/SQL or Google spreadsheets.”
We’re hoping these take off and we see more interesting visual data sets to play with around the web in the very near future.