Everywhere you look, it seems pestilence and hysteria has taken over. Someone sneezes, you wince and dig through your bag for that little bottle of Purell that, you think, will save you from the bug. Yes, it is flu season and this year is a bad one.
The City of Boston has declared a public health emergency after 700 confirmed cases of the flu. New York City officials said that the flu has reached epidemic proportions. Flu shots are increasingly difficult to find as people line up at clinics across the country. At Massachusetts General Hospital, some flu patients are getting beds in the vascular ward as more people are being admitted than the general medicine ward can handle. In Boston, my friends are scared to leave their apartments.
I don’t blame them.
Google Flu Trends Report
Once again, Google is publishing its Flu Trends report to show the spread of sickness in the United States. The data comes from people searching Google for flu symptoms and vaccines – combined with information from the Centers for Disease Control. The numbers this year are alarming.
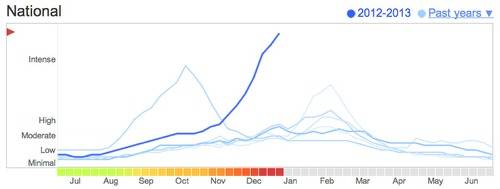
See the chart below for the national data. Notice the extremely large spike starting in December and rising to the top of the chart. Yikes!

Google Flu Trends is part of Google Insights for Search, a tool that can be used to track data related to search terms. For the healthcare industry and epidemiologists, this type of real-time data can prove helpful in tracking and acting upon the outbreak of illness.
Sometimes, Collecting Data Can Be A Good Thing
Google comes under fire frequently for its search practices and competitive position in the marketplace, but the company’s core business remains the same: to aggregate the world’s information for the benefit of humankind. Through its search engine, Google has collected a mountain range worth of data on what people do, how they do it and where they are doing it. This can be extraordinarily beneficial to researchers of all kinds.
Google describes the process for Google Flu Trends on its website:
“We have found a close relationship between how many people search for flu-related topics and how many people actually have flu symptoms. Of course, not every person who searches for ‘flu’ is actually sick, but a pattern emerges when all the flu-related search queries are added together. We compared our query counts with traditional flu surveillance systems and found that many search queries tend to be popular exactly when flu season is happening. By counting how often we see these search queries, we can estimate how much flu is circulating in different countries and regions around the world.”
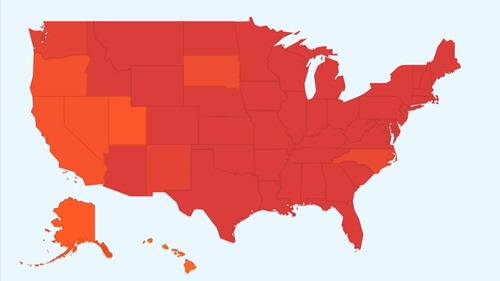
Note the map of the United States at the top of this article. It is interactive on the Google Flu Trends website to show the level of flu search activity for each individual state. As you can see, the nation is bathed in red, which indicates “intense” flu search activity.
Since the inception of Google Flu Trends, the search giant took the technology that built the tool and reversed it to create Google Correlate. Correlate is a tool is used to find patterns which correspond with real-world trends. The purpose for Google is not just to aggregate the world’s data, but to also make as much sense of it as possible.


