Online tracking firm Quantcast has just released new data that shows mobile operating systems’ current market share in North America, with the newly renamed “iOS” (originally called “iPhone OS” – the OS powering the iPhone, iPad and iPod Touch) in the lead…by miles. The Apple mobile OS dominates its competitors with a huge chunk of mobile market share, at 60%.

But don’t let these numbers fool you. It’s not how much or how little of the mobile landscape each OS has claim to, but how fast this picture has changed over the preceding months. The real winner here is Android, the OS whose rapid gains have come at Apple’s expense.
Only 20% for Android?
The latest stats – 58.8% for iOS, 19.9% for Android – may be a bit of an initial letdown for Android fanboys who didn’t read through the whole report. (And yes, Google’s mobile operating system now has its own fanboys too, sporting a level of fanaticism once seen only among those who bought Apple products.)
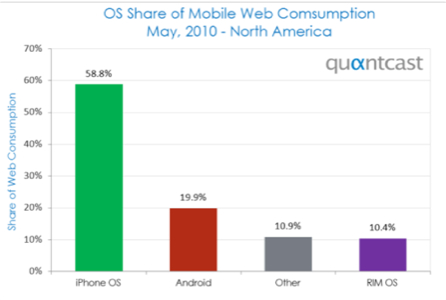
Android has just 20% market share? What? When there are8.7 million Android handsets here in the U.S. compared with 10.7 million iPhones? Shouldn’t the numbers be a bit closer? Well, if you were only comparing mobile phones to mobile phones, they would be.
In this case, though, Quantcast is comparing mobile operating system market share and that means counting the web surfing done by both the iPod Touch and the iPad, too. Combined with the iPhone device count, you’re looking at 18.3 million unique “iOS” devices. And the iPad is built for Web browsing.
Now, whether or not we should even be counting the iPad when talking about “mobile” market share is a debate for another day (are tablets more computer than mobile handheld?). Today, the big takeaway from the report shouldn’t be the numbers themselves, rather how they’ve changed.
When it Comes to Growth, the Winner is Android
As the Quantcast blog post explains, “the biggest winner is clearly Google’s Android.” How can this be?
The fact is that Google’s mobile OS has climbed rapidly over the prior months, having gone from around 5% in January 2009 to 20% in May 2010, stealing away market share from other mobile OS’s, most notably Apple’s, whose iOS dropped from 75% share to 59% during that same time frame.
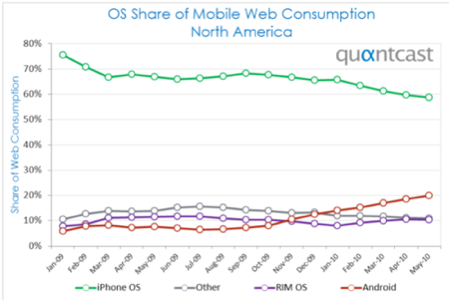
Also of note, these numbers were calculated prior to the EVO’s launch, the highly anticipated “4G” Android smartphone which sold out within days of its launch. Adding that into the fold, the next Quantcast report will likely offer even more gains for Android at iOS’s expense.
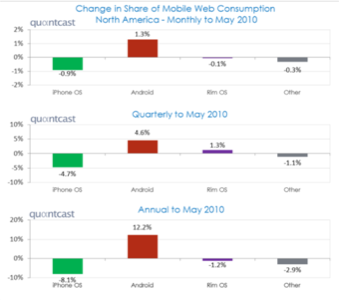
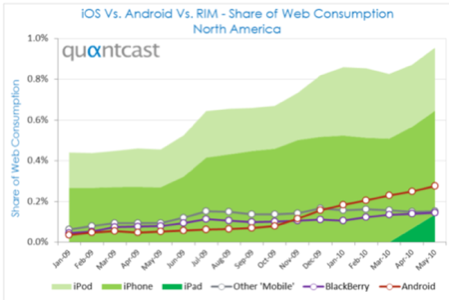
Update: It has come to our attention that Quantcast was only referring to iPhone market share in their original post, something that was unclear as they did not specify this at the time, referring to it only as “Apple’s OS” and “iOS.” Now they’ve revealed that they were ignoring the iPad in their analysis. Had they done so, the chart would have resembled this instead, as they’ve now clarified:
