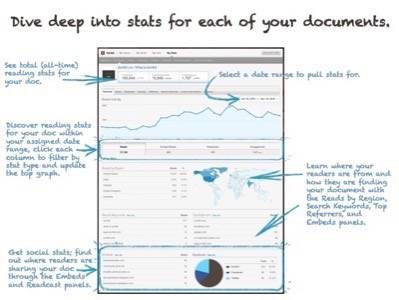
Document-sharing site Scribd has launched a new feature – Scribd Stats – that will allow users to get detailed analytics about docs uploaded to the site. The feature will be available for free on any piece of content on Scribd.

“It’s like Google Analytics for your documents,” according to Scribd. And indeed, Scribd Stats provides a similar set of tools. The analytics include an overview of all the documents you’ve uploaded, as well as the ability to drill down into information about individual items.
You’ll be able to see which documents people are reading and sharing, as well as see referring links, geographic data for your readers, keywords and search terms. You’ll also be able to view the sites where people are sharing documents, through both embeds and Readcast – Scribd’s Facebook integration.
As Scribd notes, this sort of information is incredibly valuable to publishers, “knowing how people are finding my content, where they’re coming from, and which content is fueling the most social activity.” Pointing to the heat map that accompanies docs and tracks which pages had users abandon reading, Fast Company asks if Scribd Stats could “change the way we write.” Certainly the new analytics will be able to provide a great deal of data about readership and response.
Scribd Stats are rolling out slowly to all users, and will be accessible via the “My Stats” dashboard.


