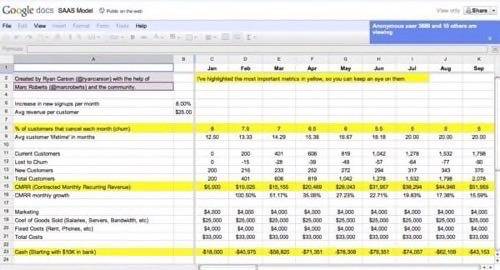
As you work to develop your product – before and after launch, it’s important that you use more than just “gut feelings” to ascertain what’s working and what’s not. Along those lines, last week, Ryan Carson, co-founder of Carsonified offered a list of six key metrics for your web app and how to track them.

It’s a great list – with definitions, calculation methods, examples, and even a link to a Google spreadsheet (see below for link) that you can use to input your own data.
1. Churn
Definition: Churn is the % of customers that cancel each month.
Calculation: number_cancellations_this_month / total_number_paying_customers
As Carson notes, churn will vary depending on the kind of app you offer. If your app is something that’s crucial to others’ businesses, such as an invoicing app, then your churn will likely be lower than an entertainment app, something that may be the first to be canceled when budgets are tight.
Using Churn, you can calculate the Average Customer Lifetime – the average number of months that a customer stays with you before canceling. The calcuation is 100 / churn_percentage.
2. CMRR
Definition: CMRR is “Contracted Monthly Recurring Revenue.”
Calculation: (total_number_paying_accounts – number_cancelled_paying_accounts_this_month) * monthly_price
Carson suggests you aim for a monthly growth of around 5% ater Churn in your CMRR. You need to be sure your CMRR keeps pace with your Churn, otherwise you will start losing money.
3. Cash
Definition: Money in the bank.
Calculation: cash_at_end_of_last_month + (CMRR – total_monthly_costs)
Likely negative for the first several months as you work towards profitability, Carson says that at , he’s aiming to be cashflow positive on a monthly basis after six months.
4. LPC
Definition: LPC is “Lifetime Profit per Customer.”
Calculation: See the Google Spreadsheet
Carson admits this is a “pretty tricky number to compute,” adding that “essentially this helps you understand how much profit each customer brings you, after all your costs.” The figure takes into account things like Churn and Average Customer Lifetime.
Carson argues that, while this number should grow, if it’s too high then it may be an indication you’re not investing enough back into the product. He says that typical numbers for SaaS apps range from 50-70% net profit.
5. CACR
Definition: CACR is “Customer Acquisition Cost Ratio.”
Calculation : See the Google Spreadsheet
This is a ratio that will tell you how long it will take for you to recover your customer acquisition costs. According to Carson, this is a useful number to gauge how much your are re-investing back into the product in order to grow the customer base (and by extension, revenue). “If it’s too low, then you’re not making enough profit. Too high, then you’re not spending enough on marketing.”
6. CPA
Definition: CPA is “Cost per Acquisition.”
Calculation: marketing_costs_this_month / number_new_paying_users_this_month
Carson contends that companies are often told to spend more on customer acquisition than they need to, and he says that he’s aiming for around 1-2 months of customer revenue to acquire a new customer.
Carson offers a Google spreadsheet for anyone to use and asks for feedback and opinions. Are there any additional metrics you think SaaS companies should track?

Photo credit: Flickr user Horia Varlan


