The horse race between the app stores has become a tedious exercise. Apple says it has 800,000 apps in the App Store. Google Play is about at 800,000 and is likely to hit the million app benchmark before iOS. But, as our readers so dutifully informed us, they do not really care. App store volume has become a non-story.
Quantifying the quality of apps between iOS and Android is a different matter altogether.
Quality, by its definition, is a subjective thing. Especially when it comes to mobile apps. People’s opinions are shaded by their affinity for one smartphone or another, choice of mobile operating system and varying brand loyalty. When it comes to Apple and Android, fans of each will scream at each other that their apps are better, more numerous and generally awesome.
Who is right? The general perception is that iOS apps in Apple’s App Store are of better quality than their Android counterparts in Google Play. There has been really no way to quantify that though the history of the mobile app ecosystem.
Until today.
We can finally say, through quantifiable data, that iOS apps on aggregate are of better quality than Android.
The Data Doesn’t Lie
What is this, you say? You cannot quantify quality? Well, that is true, to a certain extent. Perception of quality is clouded to an individual’s subjectivity. That did not stop application testing company uTest from setting out to answer the question. Today it released Applause, a service that uses an algorithm to crawl all live apps in the App Store and Google Play to aggregate every app’s ranking and user reviews to determine the quality of an individual app.
It is some powerful data and the results are fascinating.
Applause ranks every app in 10 categories and gives them an Applause Score of 1 to 100 along 1-0 categories. uTest can then look at average scores for app categories (such as games or media etc.) and yes, entire operating systems.
By uTest’s metrics, iOS apps have a mean Applause Score of 68.53. Android apps average Applause score is 63.34. The margin of difference between the two is ~8%.
That does not necessarily mean that any individual iOS app is going to be better than its equivalent or similar Android app. Each platform offers unique characteristics that can make the experience better or worse.
Upon ReadWrite’s request, the team at uTest took a broad level look at some popular app categories and compared them between the Apple App Store and Android Google Play. As you can see with the chart below, Apple generally comes out ahead in most major categories.
Note: Apple and Google do not use a common taxonomy for how they categorize apps. uTest had to map equivalent app categories to each other to come up with comparable rankings. Apps can be listed in two separate categories. Amazon Appstore for Android rankings are not included.
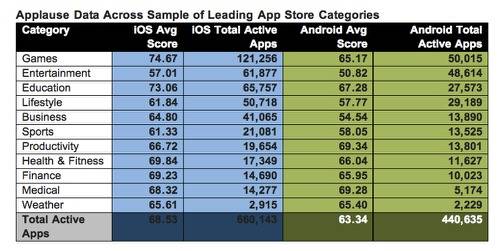
As you can see iOS ranks higher in nine of 11 top app categories (eight if you count weather as a virtual push between the two). Android comes out ahead in productivity and medical apps. While these are not straight one-to-one comparisons, the data is deep enough from a categorical level to give us a good understanding that iOS users are ranking app quality higher than Android counterparts.
When developing the algorithm for Applause, uTest was looking for two properties.
“We look for two things. One, did it have a statically different bearing on the perceived app quality, the level of user satisfaction. Second, did the keywords or key phrases that we are crawling intuitively fit into this bucket. So, for performance for example, there are really clean words like crash or freeze or hang,” uTest’s Matt Johnston said.
Case Studies
For a straighter one-to-one comparison, we asked uTest for a few case studies to highlight the difference in rankings between iOS and Android for the same app. We asked specifically that uTest compare social tablet magazine reader Zite because of its popularity and significant difference between iOS and Android versions.
If you are a Zite user on iOS and Android, you know that the two are distinctly different experiences. Zite first came to the iPad before spreading to the iPhone and Android smartphones. The app may serve you the same content across operating systems, but it by no means the same experience.
Zite’s iOS ranking was 66. For Android it is 62. For iOS, Zite ranks at or above the mean Applause Score in nearly every category. It ranks high in content (as it should) and well above the average in privacy. Zite’s iOS Applause Score is not surprising given that it is a well-liked app used by millions who are likely to review it kindly.
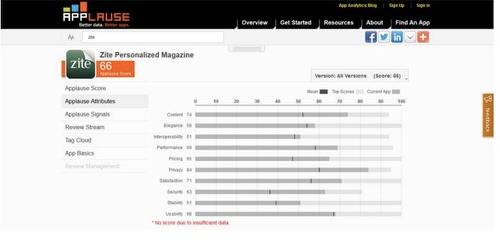
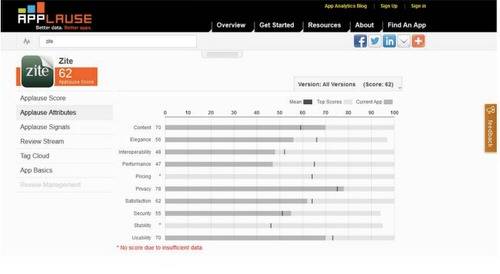
The Android app is a different story. It ranks below the mean Android Applause Score is six of 10 categories, besting the average in only content, privacy and security.
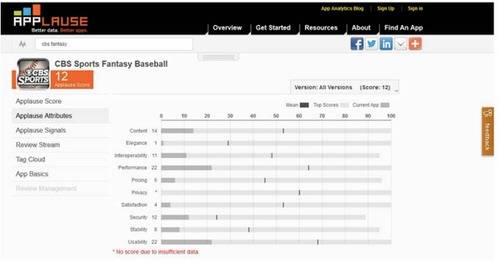
An app that performs better on Android would be CBS Sports Fantasy Baseball. This is an app I use with regularity and, have to admit, it is not terrific on either platforms. Its Android score is a 12 while its iOS score is a six. Neither version hits the mean in any single category, but the Android version does perform better in staple metrics such as usability and performance.
Trusting The Algorithm?
The bottom line is that we have to step back and assess whether we trust uTest’s Applause algorithm to determine quality on both the broad and granular levels.
Essentially, you are putting your trust in two things: the wisdom of the crowds (the reviewers on Google Play and the Apple App Store) and Applause’s ability to measure the subjective nature of such reviews. On its surface, the Applause algorithm is a fairly simple concept. It crawls and looks for key words that are relevant to certain categories (like “crash” for performance etc.) and has the ability to exclude certain comments in the case of astroturfing or black hat review tactics.
