In Jakob Nielsen’s latest book, Prioritizing Web Usability, the usability guru presents his latest discoveries on how to design usable web sites. His meticulous research is based on lab experiments, with thousands of users of diverse backgrounds.

Dr. Nielsen and his assistants observed how these users interacted with a wide array of sites, ranging from corporate portals to small business stores. The book contains solid, sound advice that is useful for anyone building an online presence. The conclusion is evident in the title of the book – usability needs to be a priority.
Getting advice from the book is great, but how can you measure the usability of your site? A number of new tools for tracking site visitors are raising the bar for website statistics tools. Particularly, instead of tracking the flat lists of usage and showing you illegible user paths, the next generation of site trackers is focused on giving you the insights on how people use a site. In this post we discuss CrazyEgg, which offers innovative ways of doing just that.
The idea behind CrazyEgg
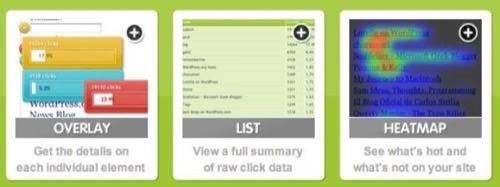
Like most good ideas, the idea behind CrazyEgg is simple – show the hotspots where users click on in a site. This information is not the same as popular pages; instead this is practical information about how and where people click on your site. More importantly, CrazyEgg’s approach lets you understand the difference between where you want your users to click and where they are actually clicking.
Traditional site tracking tools offer you a ton of information, including:
- Popular pages
- Entry pages
- Exit pages
- Came from
- Visitor Paths
- Visit Length
Ironically, it is not possible to use this information to understand what users actually do on the page. Hence, these volumes of information are practically useless in deciding what is wrong with your web site and how you can improve it. The creators of CrazyEgg saw this gap and realized there is a big opportunity to help companies assess the effectiveness of each web page. Once you look at the problem from this point of view, it becomes obvious how important it is to measure and visualize the hot spots on each web page.
Setting up CrazyEgg
The service setup is straightforward and similar to all tracking services. You are given a chunk of JavaScript to drop into each page that you would like to track. For each page, you can setup one or more tests. This is useful when you are trying to measure the effectiveness of your changes. Each test is either time based or visit based:
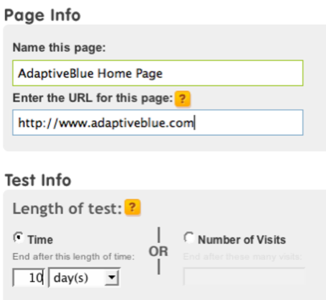
After you start the test, it runs automatically and you can check the results while it is running – as well as after the test is finished.
Interpreting CrazyEgg’s information
The service presents the results for each test using three different methods: Overlay, List and Heatmap. While both List and Heatmap are useful, the Overlay method is the one you will spend most time on. In this view, each page is overlaid with the actual usage information. The user clicks are clustered and combined into markers; and each marker is colored based on the number of user clicks. This presentation gives you instant insight into what your users click on.
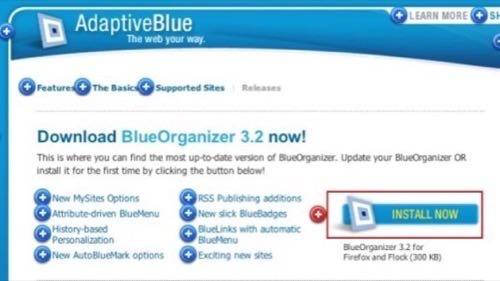
Each marker can be further expanded to see the number of clicks as well as percentage of the clicks in this spot, relative to the total number of clicks on the page. You can also drill in to see where the users that clicked there came from.
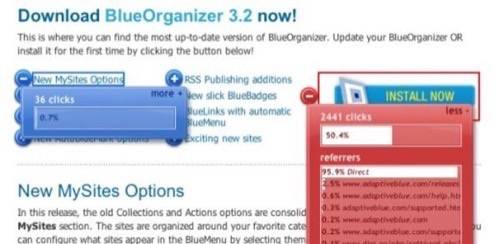
Looking at this picture allows you to determine whether your users are clicking where you intend them to click. Often, the results are surprising – because business concepts and the design elements that are obvious to you are sometimes foreign to your users. Because their context coming to your page varies, their clicks are not what you may intend. For example, one thing that you may not expect is that people click a lot on images – even if they are not linked. These clicks can be frustrating to the users, because their expectation to drill in and learn more is not met. And because attention is scarcity these days, any minor disappointment might lead them to leave the page.
Conclusion

CrazyEgg is a must-have tool in your web site arsenal, because it helps you improve the usability of your site – and improve user retention. It is complimentary to Stat Counter, Site Meter, Google Analytics and MyBlogLog (yes, you can install it on sites as well as blogs) and it will help you understand where your users are actually clicking.
But even CrazyEgg only shows you a static snapshot of user clicks. Another startup, ClickTale, is kicking the game up a notch by recording movies of how users interact with a site – and it automatically organizes the users by types of interactions.
Combine these tools with Dr. Nielsen’s book and you have a system for improving usability of your site. Greater usability will lead to more users and ultimately to greater revenues for your business. Please tell us what measuring tools you are using on your site to improve its usability.


