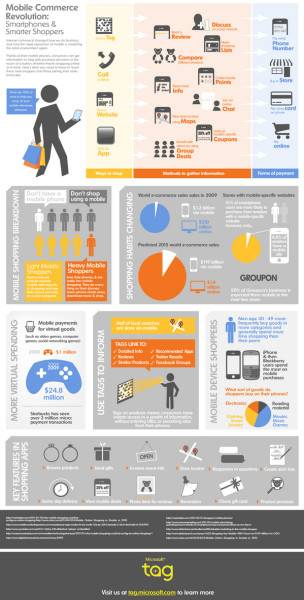
Did you know that men aged 30 to 49 do more mobile shopping than their peers? Or that 50% of Groupon’s business over the next 2 years will come from mobile devices? Or that Starbucks has seen over 3 million micro-payment transactions? These are the sorts of tidbits of information that a new infographic on mobile shopping and e-commerce trends helps to visualize.
The infographic comes from the team at Microsoft Tag, a barcode scanning app for mobile. But the trends and figures apply not just to Tag, but to mobile shopping as a whole. Some of the figures are not as current as they should be, we think, but it’s still an easy-to-digest overview of the industry.
Click to view larger: