Businesses have an extraordinary amount of online data to look after. Between Web analytics, social media metrics, email subscribers, CRM, customer support stats and project management, companies have at least half a dozen dashboards to log into and pull data from.

Geckoboard is one Web application that attempts to simplify this burgeoning overabundance of business information. It’s a drag-and-drop dashboard that allows you to plug in various sources of data and display them on a single, simple interface.
“This allows business owners to see an up-to-the-minute view of their entire operation,” said Geckoboard founder Paul Joyce. “It’s not an analysis tool. It’s more like how you would use the dashboard of your car while driving on the freeway; you glance down to check your speed, oil pressure, fuel gauge, and whether your lights are on.”
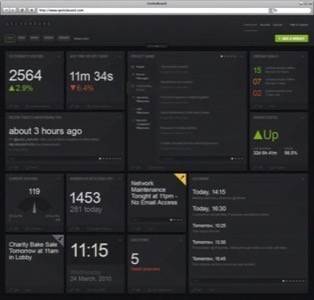
Geckoboard’s customizable dashboard is comprised of a collection of widgets, each one displaying data from a different source. As an example, you might have one box showing the latest page view count from Google Analytics, another box showing recent tweets mentioning your brand, and yet another box displaying project information from BaseCamp.
Geckoboard integrates with several popular Web-based tools and has the ability to build custom charts from any data source in XML or JSON format. The number of predefined app integrations is impressive, but it definitely has room to grow in some categories. For example, the only email marketing platform currently supported is MailChimp and the only Web analytics tools supported are Google Analytics and Chartbeat. That said, the product is in only private beta and it looks like the Geckoboard team is adding new integrations all the time.
The dashboard looks great on a desktop computer, but since it was built without Flash, it’s also compatible with the iPad and iPhone. It also includes the option to switch to “large screen mode” for companies who want to display their dashboard on a large monitor or television screen in the office.
“Many businesses like the transparency of having their key stats visible to everyone in the work space,” Joyce said. “Customer service guys can see their outstanding tickets but so can the rest of the office, likewise with project milestones, server up time, and widget sales today.”
If you’re interested in trying out Geckoboard, head on over to their site page and enter the invite code READWRITEWEB10. The first 100 people to do so will get access to the private beta