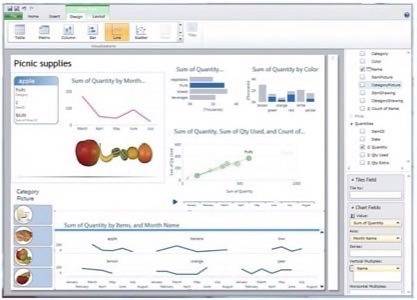
The Power View tool is meant to be run remotely, including from a service linked to a SQL Azure cloud-based database, so this is indeed a Web application. Technically, it may run from any browser that supports Silverlight. As with charting in Excel, you point Power View to your source and adapt the visualizations to best suit how that data may be explained to a viewer, and you do so without impacting the data itself.
One new tool called the slicer, added to the project during its public preview phase (proof that Microsoft can indeed incorporate good suggestions during a public preview), lets the user select a segment of data in a table to pull out and either highlight in the context of the bigger chart, or demonstrate within a separate graph. Then by creating what Power View calls cards, you can take a record about one of the items depicted in a chart – for example, one of the factors that the chart is comparing, like HP’s share price to Dell’s or Angus cattle prices compared to Hereford – and generate what Metro would call a “tile” for that item.
The card can show a picture and some recent data about the item, and clicking on it can trigger the chart to “pivot” around it, showing either the highlight or the slice you created earlier.

The result might have you imagining producing your weekly meetings the way CNN’s John King dances around his big board on Election Night, poking on-screen cards by hand and watching the results zoom into the foreground.
History has demonstrated that if one of the teams at Microsoft believes so sincerely in their technology that they don’t want it to die, bestowing upon it the word “Power” gives it an almost magical ability to survive, and perhaps even thrive. During the development of Windows Server 2003, a truly revolutionary command line tool code-named Monad threatened to invalidate the need for a graphical operations management tool. In 2006, its developers managed to get its name changed to PowerShell, and though executives refused to enable it to ship with the server itself, the company agreed to distribute it for free from its Web site. It was a fateful decision; at a time when other companies had already discovered the tremendous power of free distribution, Microsoft decided to distribute PowerShell for free, perhaps with the intent of watching it dwindle and fade away.
The opposite happened, of course: Now the tool has become an integral part not only of Windows Server but of Exchange – indeed, the graphical Exchange operations are all built around PowerShell scripts. So now that Silverlight is being tucked away inside some data visualization tool – at a time when data visualization tools are becoming the axis of an entirely new ecosystem of the database and data storage industry – little ol’ Power View may breathe some new life yet into the technology. Indeed, we could be seeing a kind of architectural divergence, where “business Windows” based on the Desktop model thrives as “consumer Windows” on the Metro model goes its own direction.


