Logging statistics is a two-stage process. First, you need to collect the information and store it. Next, you need to expose this information to end users.
It’s quite simple to display a table of stats for users to look at, and this is a good option if you need to provide a detailed breakdown. But for analysing large datasets or simply providing an overview of recent activity on a site, a graph may be a better approach.
Flot: a JavaScript Plotting Library for jQuery
For this example we’ll be using Flot, a jQuery library. To get started you’ll need to download jQuery and Flot. Once you’ve included them in the page header, here’s how you can get a simple line graph to show up.
Preparing the Data
Before displaying the graph, you’ll need to load up the following data:
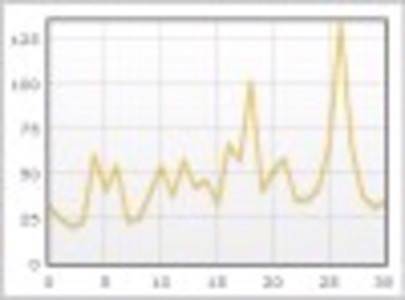
- The values you wish to display in the graph – in this case, we’ll be looking at pageviews recorded in the last 31 days for a specific blog.
- The maximum value in the group.
As Flot is a plotting library, you need to think of the coordinates to add each point to the graph. For instance, on the first day the blog recorded 157 pageviews, so you need to plot a coordinate: 0, 157. On the second day, the blog recorded 187 pageviews, so the coordinate for that day would be: 1, 187.
Basically, the end result is a list of values provided in the following format:
[0, 157], [1, 187]
And so on. We can then use the value list in the next section.
Displaying the Graph
First, you need to use the following HTML:
Change the height and width if you wish. Next, you need the following JavaScript:
Ensure you replace INSERT_VALUE_LIST_HERE and INSERT_MAX_VALUE_HERE with the appropriate variables.
A Working Example
You can see a real example of the Flot graph on the profile page of the blog in question.