When AB InBev (Anheuser-Busch) announced plans to purchase SABMiller (MillerCoors) in a $107 billion deal, analysts went to work right away to figure out what impact this merger could have on the combined company’s bottom line. For innovative market research company EyeSee, the answer to that question could very well come down to how the brand utilizes its in-store shelf spacing.
EyeSee is a market research company that operates a bit differently than most. To start, much of its market research takes place in front of a computer screen, rather than in a room with a focus group of consumers. Survey calls are set aside in place of consumers actually looking at the different options before them online.
More importantly, EyeSee uses the subject’s own webcam to conduct much of its critical data gathering by tracking their eyes as they participate in the study. EyeSee’s technology can also track facial expressions, giving researchers a more big-picture view of the subject’s response to what they’re seeing.
This technology doesn’t just offer a unique insight into a shopper’s experience. It also enables a much faster turnaround than many other large-group surveys. On EyeSee’s website, it breaks down the process of initiating, conducting, and receiving results for a study. It all takes place in about a week’s time. This is an interesting proposal for companies that are interested in doing some a-and-b testing without going through the time and expense of actually conducting the live tests in a store.
So how do drinkers differentiate between common brews?
Where does this technology come into play for a company that produces alcohol? For one, it can help determine which shelf arrangement has the best chance of turning a better profit.
When it comes to AB InBev and SABMiller, these two brands each have a whole host of options in their product line – many of which are very similar to one-another. Since they’ll be working together rather than competing with one-another, the challenge is to find out what percentage of each brand’s products to place on the shelves, and in which arrangement, is most likely to entice a consumer to make a purchase.
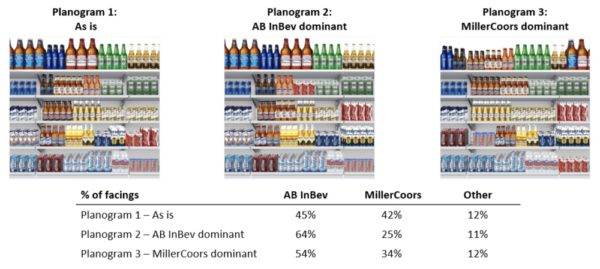
EyeSee put these two brands to the test: combining their product lines in a display that was shown to 900 beer shoppers in the United States. The results are stunning. They tested three different display configurations:
- Planogram 1: “As is” neutral shelf which is used as base case scenario,
- Planogram 2: Shelf where AB InBev’s products are dominant
- Planogram 3: Shelf where SABMiller is dominant.
Each configuration was tested with 300 of the 900 shoppers participating in the study. In the baseline planogram,AB InBev’s products were selected 59% of the time while SABMiller received a healthy 41% of the sales.
In the second planogram, where AB InBev’s products received the majority of the shelf space, overall sales increased 2% with AB InBev receiving 76% of sales to SABMiller’s 26%.
The third planogram did not perform as well. Giving SABMiller the dominant shelf space decreased overall sales by 8%. AB InBev received 45% of the total sales to SABMiller’s 47%.
This study one of several types of studies that EyeSee conducts to better understand shopper’s buying and browsing habits. If EyeSee’s methods begin to catch on, it may not be long before we start seeing cameras pop up in real-world storefronts. But, at least for the time being, this is another unique tool in the increasingly scientific world of marketing.


