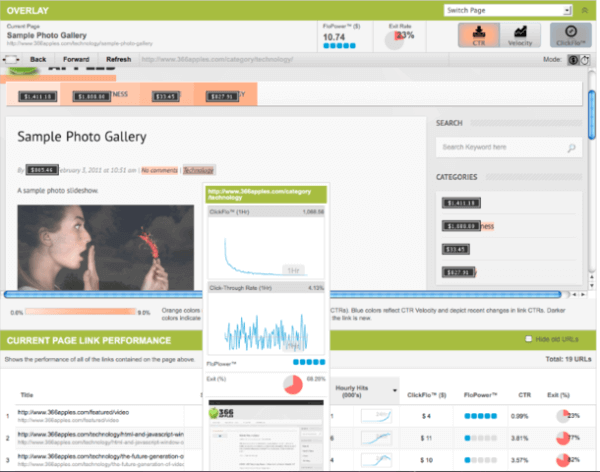
If you run a website, you want to add content that will result in actual money being collected from the most popular areas on your pages. Wouldn’t it be nice to know what the dollar implications of your content decisions are so your editorial team can best use your screen real estate? That is genesis of JumpTime’s latest analytics service called Traffic Valuator, available now.

JumpTime places an overlay on your website with dollar values for each piece of content such as an icon, a hyperlink, or a headline. Of course, these values are dynamic as people click around your site, so there is a lot of real-time calculation going on. You can see a sample of their service (using fake data) in the screenshot below, and you can click on the image to enlarge it.

You can drill down and see what is going on over time so you can track traffic trends. The service is very graphical, showing “heat maps” with the most popular links highlighted with darker color overlays. You can quickly see what parts of your website is generating lots of traffic but not necessarily any revenue, or vice-versa, and what happens when you move content that is underperforming to a less prominent place.
There are lots of analytic tools from Omniture and Web Trends that do page view overlays but that don’t include the actual value of the clickstream. There are also reporting dashboards for management, similar to these other tools.
Pricing starts at $3000 per month and depends on the site complexity.


