If you’ve ever used the Internet — and you know who you are — you’ve undoubtedly had apps or various services stop working unexpectedly. For ordinary users, this usually just means no access to Twitter or Gmail for a while. But for developers, whose apps and services rely increasingly heavily on hooks into popular Web services, the problem can be far more complicated.
That’s because modern Web services (and the apps that facilitate them) can fail for a variety of reasons. One of the most common problems arises when some other service has gone down — more specifically, when the application programming interface (API) that lets your app tap into that other service stops working. Trouble is, until recently there hasn’t been an easy way to confirm or rule out API failures.
You Don’t Need A Weatherman…
And that’s where API status dashboards, the weather reports of the Web-service world, come in. Dashboards enable developers and administrators to quickly check to see what’s going on with the API itself. If the API is slowed or offline, then at least you, the developer, know the problem isn’t in your own code. So you can start working with (translate: yelling at) the API vendor to fix the situation.
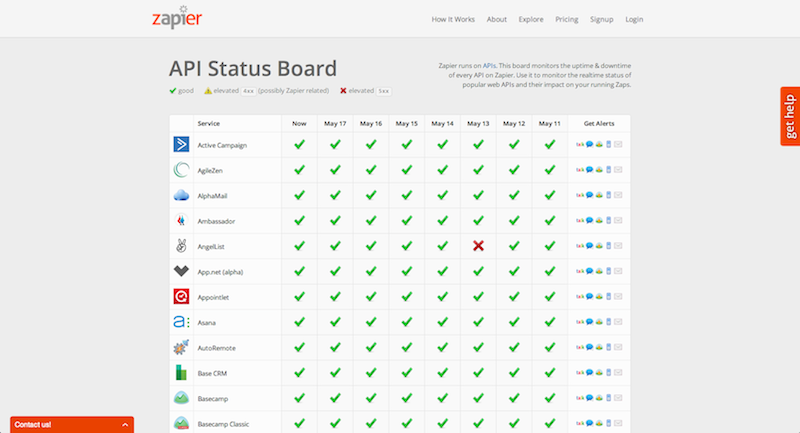
Zapier, a startup that helps developers integrate APIs into applications, was already using just such a dashboard for its internal purposes. It’s now opened up that API weather report for the world at large. Zapier’s tool is unique in that it covers a lot of APIs for smaller but still useful services out there, not just their mega-service cousins. It should be a stopping point for anyone who is using one of these smaller APIs.

…To Tell You Whether APIs Are Up Or Down
It might seem a little obsessive to be so concerned about an API’s status that we build “weather reports,” but it makes good business sense. Like the air around us, APIs are a type of environment, too. They have to work and be available at any given moment in order to enable connectivity to a given web application and service. When they fail, data exchange can slow down or completely halt.
Of course, API failures aren’t the only things that can bring down a Web service. The service itself could have bad code, or one of the servers might be on the way to failure. Tracking down the exact failure, though, can take a lot of time, especially if hardware failure is ruled out. That leaves the code itself, precipitating a search that could take hours.
So it’s definitely helpful to know right away whether you’ve got an API problem… or something else. “When a call to an API breaks,” says Zapier CEO and co-founder Wade Foster, “you don’t always know where the problem is.”
But Weather Reports Help
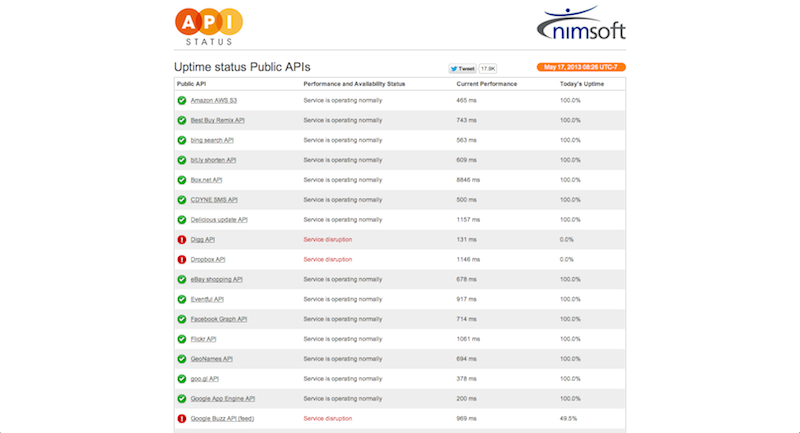
Zapier isn’t the only status board around. Watchmouse has an API Status board that monitors the larger API services, such as Google, Twitter, Dropbox and the like. Its technology was so attractive that CA bought the company in 2011 and incorporated the monitoring service into its Nimsoft Cloud Monitoring tools.

Unfortunately, it’s not entirely clear that the public Nimsoft page is up to date. The page is currently reporting disruptions for Digg, Dropbox and some Google services. The latter seems inaccurate, since Google itself isn’t reporting any issues today.
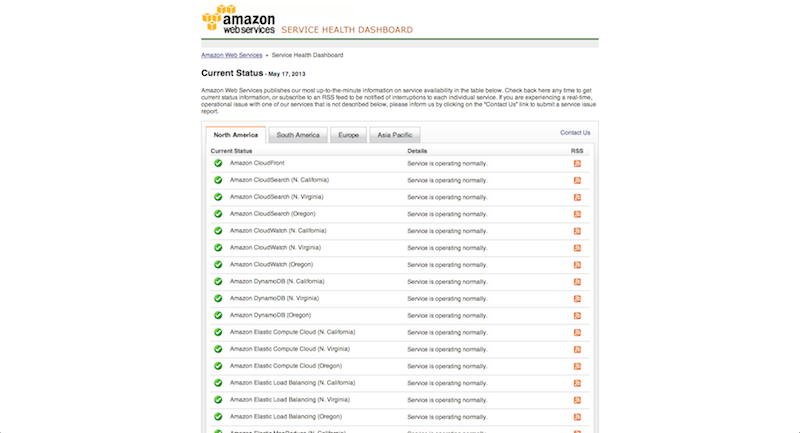
Of course, if you have an app that depends on Google services, you can always check out Google’s API status page. Amazon Web Services has its own API and service reporting dashboard, too.

If you’re building an API for your own service, you can provide your users with a quick status dashboard of your own, using the Stashboard code that was open sourced by Twilio a few years ago. Developers can use the code to create a dashboard that can be hosted on Google Apps Engine.
Lead image courtesy of NOAA


