Continuing our focus on business apps for the iPad, today we look at tools for visualizing data and information. The iPad’s interface begs to be used for manipulating visual information, and it certainly delivers. And if you’re used to creating charts and diagrams at your desk with Microsoft Excel or Visio, these five apps will deliver comparable tools that you can use from anywhere.

Numbers
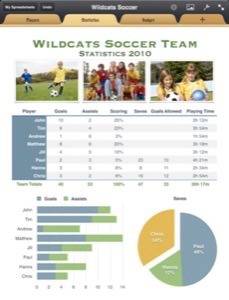
Numbers is the spreadsheet application Apple’s iWork suite. The iPad version, like the desktop version (and most spreadsheet applications), can create various types of charts and visualizations from data within spreadsheets.
OmniGraffle and OmniGraphSketcher
OmniGraffle is an iPad app for building charts, diagrams and other visualizations. It’s pretty expensive at $49.99, but it has a dedicated following. It’s also available for OSX.
OmniGraphSketcher is a cheaper alternative priced at $14.99.
Roambi Visualizer
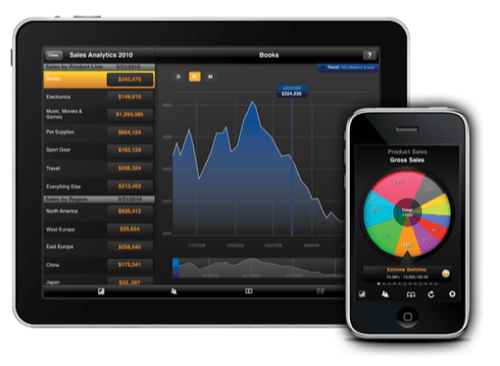
We also covered Roambi Visualizer in our round-up of business intelligence tools for the iPad. It can visualize data from sources such as SAP Business Objects, SAP Crystal Reports, IBM Cognos, Excel and Salesforce.com.
The free version only works with Excel, CSV files and HTML. The pro version, which costs $99 a year per user, adds support for Google Docs and Salesforce.com. Pricing varies for the enterprise edition, which offers support for many more formats.
Easy Chart HD
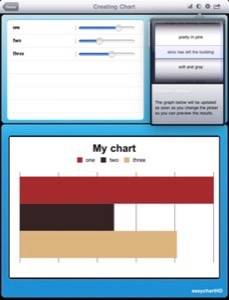
On the lower end, Easy Chart HD is a simple and inexpensive ($.99) way to create and share bar, line, pie and sidebar charts.
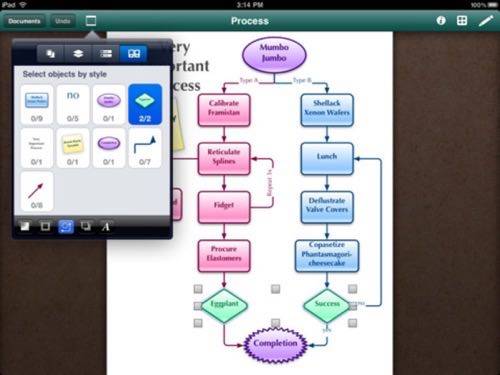
Instaviz
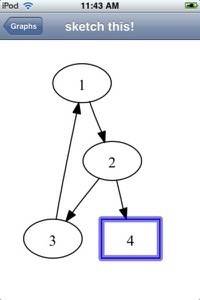
For those just looking for a way to organize concepts, thoughts and ideas on the go, Instaviz is a diagramming app for building flowcharts and mindmaps.