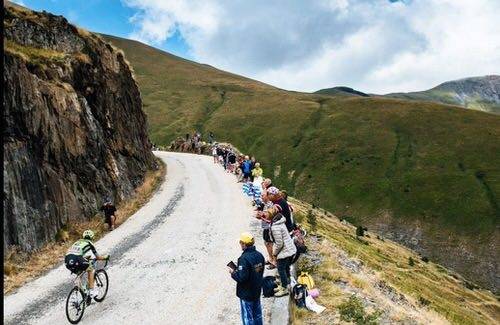
In 2015, Dimension Data became the official technology partner for the Tour de France, the world’s largest and most prestigious cycling race. In support of their goal to revolutionize the viewing experience of billions of cycling fans across the globe, Dimension Data needed to analyze thousands of data points per second, from nearly 200 riders, across 21 gruelling days of cycling.
They chose to partner with IBM and leverage their streaming analytics platform, InfoSphere Streams. The joint team developed a winning solution that provides advanced analysis of rider data, calculating dynamic race position ranking and grouping of riders.
What changed things was putting GPS sensors on every bicycle and installing a sophisticated relay system that transmitted data to central servers, and then to apps, Web sites and broadcasters. The racers and their bikes were data-collection points on the Internet of Things. The goal was nothing less than transforming the Tour fan experience.
One of the key ingredients in this setup was IBM Streams technology, which gathers data from many sources in real time and organizes it so insights can be drawn from it. In the future, thanks to a new but related IBM technology, Quarks, cycling fans, broadcasters and team strategists could gain much deeper insights during the Tour.
Quarks is an open source project that makes it makes it easier for developers to create IoT applications to analyze data on the edge of their networks.
I spoke to Chris Howard, Big Data Technical Leader at IBM Asia Pacific, and Nagui Halim, IBM Fellow, about the collaboration.
RW: What lead to the collaboration with Dimension Data?
Chris: Dimension Data actually won the partnership rights with Amaury Sports Organization (ASO), the company that own the Tour de France, to provide their technology and their analytics platform for the next five years. Really, what they were looking to do was revolutionize the viewing experience for spectators of the Tour de France and really bring it into the 21st century – or even into the 22nd century. And the reason for doing that is that if you look at the way data is both captured, processed and analyzed historically with the Tour de France it’s extremely manual.
It literally relied on people with stopwatches and radios and timing boards radioing back to base about which particular rider has passed which particular milestone. It was very, very cumbersome and quite old-worldly in nature. And looking at how do they group the riders, so if you look at the pack of riders that may spread out over 30 kilometers or more over 5 or 6 hours of the race, how they group the riders was also manual, it was somebody literally hanging off the back of a motorcycle or sticking their head out of the sunroof of a chase vehicle and someone would (check) the race numbers on the shirts and say “Well, there’s 15 people on that group, there are 12 people in that group, oh, and one of them’s just changed groups.”
That would be radioed back and the graphics team would then produce all of their updates and that would then get spread out for updates. So, if you were unlucky enough not to be part of one of those groups, as a rider, there’s no real visibility of who you are and where you are – from a television standpoint, you may as well not exist and no one would know you were even part of the Tour De France or what progress you were making at this stage.
In March last year, we began investigating how we could use IBM’s Streams to analyze a lot of this data, given that they were looking to essentially instrumentalize every single bicycle. Every bike would be intrumented with a GPS receiver which had to ability to relay to a local motorbike or race vehicle that would then manage the signal up to an aircraft and the signal would end up being a mobile data sensor that was stop at the finish line so you could then use that data to do interesting things.
RW: What did the data mean in a practical sense?
Chris: For ever single rider – and last year we had 198 riders – we were getting a positional fix every second, the latitude and longitude and the speed of every single rider. And from that raw data, we then did lots of things to determine their journey so far, how far they’d progressed, the ranking of the riders, the distance and times between all of the riders. Automatically grouping the riders into the constituent parts of the peloton and then being able to push that data out to a website for consumption by spectators and also broadcast purposes. All had to be done quite quickly – in many cases, a couple of seconds at a maximum. So Stream’s solution was working on a sub-second time slot that we were allocated to do all of the analysis and then the arrival of that data and get that data out.
A back story to the Tour de France – and that had really not been seen before – began to emerge in terms of the profit and progress of the riders and starting to understand the way in which gaps evolve, how the group handles itself, how the peloton shapes itself and what happens when riders slow down to collect their feed bags and what does that do to the average race speed.
There was one particular event where there was a very large crash and it shows the average speed of all the riders very quickly drops off to zero as the riders all hit the tarmac. In terms of involvement, most of the teams took up the opportunity to deliver a white label version of the data, so you could go to their team website and see the visualization process and a comparison between their team members all the rest of the riders.
RW: The Tour de France has been happening for such a long time, why has it taken so long to get this kind of data system? Is it because of the cycling industry or a lag in technology?
Chris: There are a number of factors. ASO owns the tour but not the teams or the riders, so I think there’s probably some political resistance to having people instrumented and starting to reveal details about location and so on. And I think if they move forward with things like power output data, cycling cadence, pedalling cadence, respiration, heart rate, that’s quite sensitive and certainly could be used in a competitive nature so you’d have to be careful as to how that data was shared.
Nagui: In a nefarious sense, you could probably determine if there’s doping going on due to anomalies to normal behavior.
RW: Aren’t the riders utilizing wearables already?
Chris: They do, they have a head unit on the bike for capturing data for retrospective analysis, and certainly having access to the real time data for a team director would be hugely relevant and very useful. The other challenge is we can’t do this through Wi-Fi, cellular coverage is often very spotty up in the mountains, and there’s the task of backhauling this data – getting it to the point where you’ve got consistency in delivery and maximizing the availability of the signal. There’s literally a fleet of vehicles – bikes, cars, planes, helicopters – that follow the Tour and deliver everything from broadcasts to food. It’s challenging to get access to the data.
(As for Quarks) We believe that starting to provide some edge processing adds a whole new dimension again, and so looking at the terrain, the way the data is captured – cyclists going through tunnels, going down extremely steep gradients being able to do things like capture the data and do a store-and-forward model where we can do virtual updates to fill in any gaps in the data that might have occurred because of terrain.
We do a lot of inferring from the data to determine whats actually happening out on the road, what does this location speed actually represent, and as we view multiple riders, we can look at some of the interesting patterns that comes from combining the data. Most devices on the back of the bike include accelerometers, gyroscopes and pressure sensors, and therefore if you find from your gyroscope that the bicycle is upside down, you can determine if it was a gradual decrease, maybe the rider had a puncture….and if it was a sudden decrease, perhaps a crash. Local events might involve an alert that is sent back up to the data centre to allow stream reporting
RW: Any there any specific things learned from last year’s efforts?
Chris: There’s an awful lot more that you can start to understand about the race as it unfolds, and the ability to compare individual riders and against prior performance means we can start to infer things like the gradient of ascent, from one particular state of a course, and looking at where they may be similar elsewhere and we start to use that for predictive purpose. We also gained an understanding in what might be interesting to spectators, how can we deliver a compelling viewers experience – how to we enhance that with more advanced analytics – to gain more excitement.
RW: Is there applicability in other areas?
Nagui: We’ve been approached by different industries, including horse racing and also the Indianapolis Motor Speedway. Conversely, we offer similar depths of data in monitoring patients with the treatment of their diabetes. Quark is applicable in so many different spaces.