Webtrends has launched the ninth version of its Web analytics platform for the enterprise, and it’s impressive indeed. In addition to a standards-based interface that’s data-driven and accessible, three new features make Webtrends 9 stand out from the crowd.

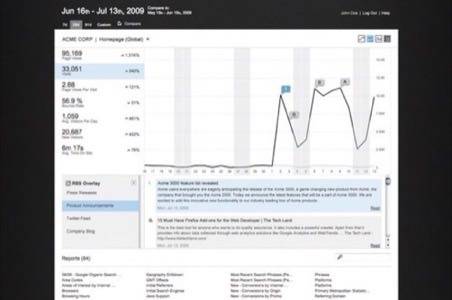
First, there’s a selective RSS overlay to let you match site activity with key feeds. Second, you can now generate URIs and REST urls to export your data and embed it in applications and Excel spreadsheets. Last, but definitely not least, is the story view, which automatically turns your entire analytics report into a short narrative for use in emails, reports, and presentations.
A Minimalist Interface
Both Yahoo! and Google analytics are known for their colorful interfaces and reliance on Flash and JavaScript. Webtrends 9 has taken the opposite approach, with a mostly gray-scale dashboard that uses color very sparingly to highlight small points.
More importantly, Webtrends 9 only uses HTML, CSS, and JavaScript, not Flash. This means it’s actually usable on devices that don’t support Flash, like the iPhone. If you have JavaScript turned off, it also automatically downgrades without losing any functionality.
Bells & Whistles
Google and Yahoo! might work just fine for personal websites and other consumer Web analytics needs. Webtrends has always differentiated itself by focusing on the enterprise market, which needs different metrics and greater security.
But several of the features new to Webtrends 9 are just plain cool, whether you’re in the enterprise or not.
An automatic story view might not be flashy, but it’s darned useful, both as a presentation technique for others and for those who may be less graphically inclined. The sharing to other services like Excel was ridiculously easy, and the business need for that kind of exporting is crystal clear. In testing out these new features ourselves, we found Webtrends to have a degree of depth and flexibility that would appeal to anyone, not just the business-class customers they target.