If any company has a comprehensive view of Web browsing behavior, it’s Google. Not only does the company see plenty of traffic to its own properties, but thanks to Google Analytics, the search giant has plenty of insight into average site metrics Web-wide. Not only that, Google shares the data from sites that have opted in to share their data anonymously – and KISSmetrics has packaged up the results into a handy infographic. Among other things, it shows a drop in Windows users browsing the Web and referrals driving less traffic in 2011.
The survey compares results from November 2009 through February 2010, and November 2010 through February 2011. Google has found a slight decline in the number of pages per visit, average time on site and the bounce rates. Though none of these are dramatic, there’s a clear picture of people spending slightly less time on site. Pages per visit have dropped from 4.9 to 4.5, the bounce rate is down 1.2% to 47%, and people are spending an average of 26 seconds less on sites.
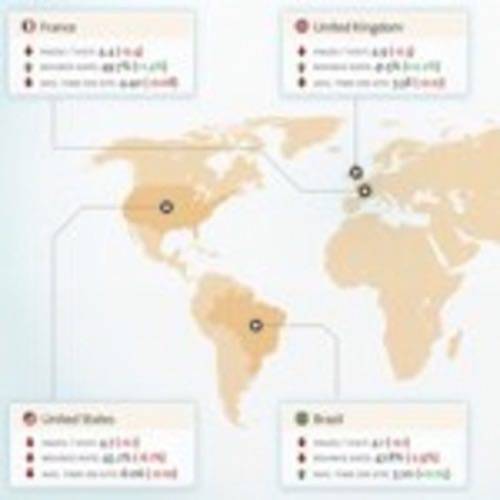
Which countries have the shortest attention span? If your target market is in Aruba or Saint Lucia, you’re in very good shape, if it’s China maybe not so much. Aruba and Saint Lucia have a bounce rate of just 30%, while China averages 58%. The United States comes in at 42%, along with the U.K., and New Zealand. Germany and Japan average 48%, and Russia is at 52%.
Traffic from search engines is up by an even 1% to 28%, but referral traffic has dipped 1.6% to 19.4% of traffic. Direct traffic is up by just 0.3% to 36.8%, and “other” is also up by 0.3% to 15.8%.
The operating system statistics should surprise no one. Windows has dropped by 5.1% to 84.8%. Does that mean Macs and Linux are picking up the slack? Not exactly. Mac OS X has picked up, but only by 0.7% – bringing it to 5.2% of Web traffic. Linux, I’m sorry to say, has only picked up 0.1% and isn’t even showing 1% of traffic, coming in at 0.7%.
The big gain is likely mobile devices, which are in “other” according to the survey. That traffic has grown considerably since 2010, with 9.3% in late 2010 and early 2011 against 5% in the previous survey.

None of the stats have changed radically, excepting the “other” traffic, but it’s good to keep an eye on these trends if you’re concerned with your organization’s Web presence. If anything is clear from these numbers, it’s that companies should be paying attention to their mobile sites. Grab the biggie-sized graphic at KISSmetrics as a PNG or PDF.