Most people are aware that you can debug your own programs with gdb, but did you know it’s also great for understanding performance problems in programs that you don’t even have the source for or that you can attach to running processes at any time?

When I notice one of my machines is running slowly, the first thing I do is run the top unix command from the terminal to see where the time is going.
top
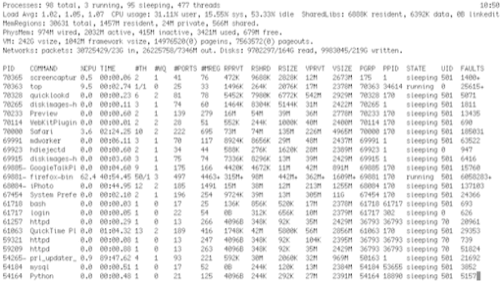
This shows me that Firefox is taking up about half of my CPU, but doesn’t tell me much about why. To get that information, make a note of the process number, press q to quit top, fire up gdb with the -p switch and that identifier, and it will hook into the running process:
gdb -p 69881
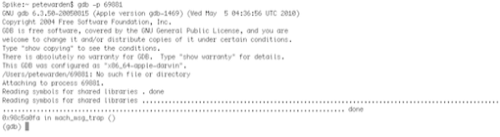
This pauses the program, so now run the command thread apply all bt to see what it was working on at the instant it was paused:
thread apply all bt
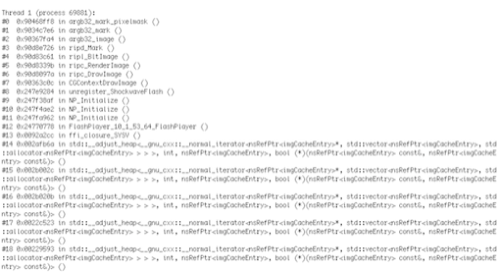
Even though we don’t have the source code, you can often get a decent idea of what the code is related to from the function names. There’s a lot of threads here, but the one we’re interested in happens to be the main thread, listed last. You can see that the stack trace has functions that look Flash-related, and the lowest level ones (highest up the screen) appear to be image-drawing code. This is a clue that it’s spending time in Flash image rendering, but to be more certain we need to gather more samples. To do this, enter the c command to allow the program to continue running, and after a second or two press control-c to pause it again and do another thread listing:
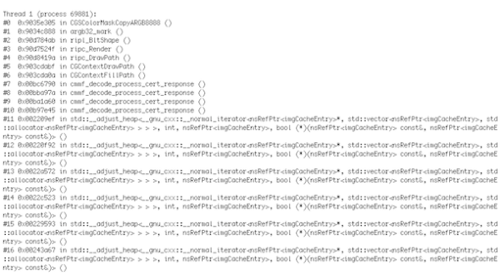
Here it’s no longer in Flash, but it’s still doing image rendering, so the odds are that Firefox is bogged down by something graphics-related. You can repeat this process multiple times to gather more and more evidence, and you’ve got a poor man’s version of a profiler.
The place I probably use this approach most often is when a program appears to be completely hung. By following exactly the same steps you can often spot if it’s truly in an infinite loop, or if it’s just making really slow progress or swapping memory like crazy. If it is in an infinite loop, the clues from the backtrace function names are often enough to figure out what provoked it, and how to avoid running into the same problem in the future.