Last November we put up a guide to the most popular Twitter clients. For that post we looked at a random sample of 717 tweets from a handful of heavy Twitter users and identified 19 different ways people interacted with the service. Twitter has one of the fastest growing application ecosystems of any web service outside of Facebook. For this post, we looked at 37,248 tweets and found 142 different ways in which people interact with the Twitter service. Some of the results, which follow below, were rather surprising.

How We Gathered Data
We used the Twitter API to monitor the public feed and capture data on 37,248 tweets over a 24 hour period. We had usable data after about 2 hours, but wanted to let the program run overnight to remove any geographic biases due to timezones. It is interesting to note, though, that the top ten results basically didn’t change after the first couple of hours — though a couple of services swapped positions. That suggests that for the most part, people probably interact with Twitter in the same methods on either end of the globe.
Because we ran our script on a shared host, we limited our script to running at 60 second intervals and grabbed the 20 tweets listed in the public feed every 60 seconds. Since there many have been more than 20 tweets each minute we probably missed a handful of them (if there were less than 20, we only grabbed the new ones). Even so, our 37k is enough data to draw conclusions from.
The script that we used to do this was created for us by developer Kelli Shaver, who also compiled the data for the PDF report linked to later in this post.
The Results
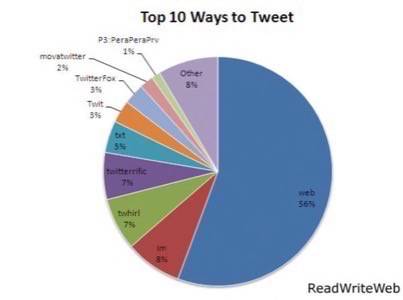
Let’s get right down to it. One trend that carried over from our November sampling, was that the web continues to be the #1 way in which people post to Twitter. It accounted for 56% of all tweets that we recorded. IM and txt (SMS message), which were also popular in November, remained popular, accounting for 8% and 5% of all tweets respectively.
But that’s where the similarities end. Twitterific, which once ruled Twitter alone as the most popular 3rd party client, suddenly has company at the top. Twhirl now serves slightly more tweets than Twitterific, though both account for about 7% of the total. Snitter, which we found served 4% of tweets last November, has fallen out of favor and is now just the 15th most popular method of interacting with the service; it accounts for less than 1% of the tweets we recorded.
Below is the a list of the top 20 ways we saw people tweet and a graph showing the Twittersphere share of the top 10 post methods:
- Web 56% (20734)
- IM 8% (2975)
- Twhirl 7% (2754)
- Twitterrific 7% (2462)
- TXT 5% (1683)
- Twit 3% (1182)
- TwitterFox 2% (1114)
- movatwitter 2% (718)
- P3:PeraPeraPrv 1% (459)
- Netvibes 1% (266)
- TwitBin 1% (260)
- Twitter Tools 1% (222)
- TwitterPod 0% (159)
- TwitterIrcGateway 0% (152)
- Snitter 0% (147)
- BeTwittered 0% (106)
- Tweetr 0% (95)
- NatsuLion 0% (84)
- Facebook 0% (79)
- PocketTweets 0% (70)

Key Takeaways
Some of the main things we learned from this study:
- Twitter.com is good enough for the majority of Twitter users. Though clearly the API has enriched the service (142 different post services identified in 24 hours! — and that doesn’t include non-client uses of the API such as the polling startups we covered yesterday), the service is still bringing the majority of its users to its site. That potentially bodes well for some type of ad based monetization down the road.
- Twitter users are early adopters (that’s not something we learned from this study, but something we already knew anecdotally), and early adopters are also often iPhone users. It’s probably important to note that unless you’re using an iPhone specific Twitter client like PocketTweets or iTweet from your iPhone, those tweets are counted under “web.”
- For all the press that FriendFeed got last week for allowing people to post replies directly to Twitter, it was still 65th on our list and registered barely a fraction of total tweeting activity. Some analysts think FriendFeed is a threat to Twitter’s existence, but remember that 56% of users still interact with Twitter on the main site, and Twitter makes up 44% of activity on FriendFeed. So which service is really more reliant on the other?
- There are a ton of Twitter clients out there. We saw 142 different ways to interact with Twitter in just 24 hours of monitoring the site’s public feed. That’s an amazing amount of activity on their API, and their application ecosystem is growing every day. Clearly, Twitter has struck a nerve with developers and users alike.
- We saw a large number of foreign language clients that we didn’t see in November (especially from Asian countries). This is most likely due to that fact that we monitored the public feed this time around, while in November we looked at tweets from the contacts of just a handful of users — and thus had an unavoidable language bias built in.
- We also saw a growth in posting from non-client outside sources such as Facebook, Netvibes, and yes, FriendFeed.
You can download our raw data (the full list of post methods that we logged) here (PDF).
What else do you think these stats tell us? How do you post to Twitter? Let us know in the comments below.


