New research sponsored by Facebook out of a Milan computer science university shows that the old saw of there being six degrees of separation is no longer accurate. Call it 4.7 degrees instead. The researchers used a random sampling of half a million Facebook users who were active in May 2011 and mapped their social graphs.

There were two academic research papers that were posted last night. One of them looks at how many friends people have, and found that this distribution differs significantly from previous studies of large-scale social networks. The second paper discovered that the degree of separation was a lot smaller than previously thought, and is growing smaller over time. Facebook claims it is the largest social networking study to date, and given their user population, that is probably accurate.
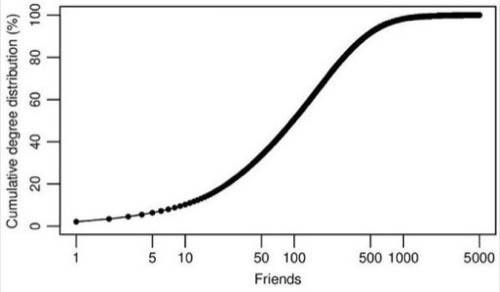
First up is this graph that plots the number of friends each user has against the “cumulative average distribution” on the Y-axis. This latter measurement shows the percentage of users who have less than the given number of friends. So you can see that 10% of the total Facebook population have less than 10 friends, and 50% have less than 100 friends. So much for friending envy. The distribution shows that the average friend count is 190 people. My personal goal has always been to have more friends than my 20-something daughter, but that probably is unattainable. Still, I guess I shouldn’t feel so bad that I am in the 90-something percentile, at least according to this analysis.
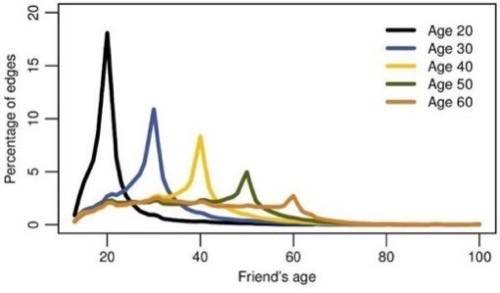
Perhaps not surprisingly, the distribution of the ages of your friends closely matches your own age. The red line in the graph below shows what the age distribution of your friends would be if were to follow a more random pattern.
The researchers used a 24-core CPU with 72 GB of RAM for one study and a 2,250-node Hadoop cluster for the other. Hadoop had its origins at Yahoo and is used extensively at Facebook, so that was quite appropriate. The post on Facebook Data’s site goes into more detail, and has links to the two academic papers, which go into much more detail. If that is too much to ponder, then consider the following graph:
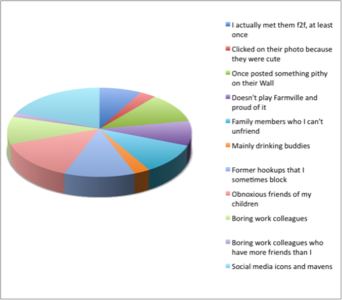
I put together my own analysis using an Excel spreadsheet and fake data to come up with the pie chart. Here I posit that the types of lists of friends that I have already created for my own account are typical of the many millions of Facebook users. You tell me what you think.