I have written quite a bit of code in my life. The languages I used were all assembly or high level such as Cobol (yuck), Pascal, C,C++, Java and some not so well known like Algol and Smalltalk 80. I have never done much with HTML apart from poking around in other peoples stuff, changing some bits just learning what I needed to make the necessary changes.
Today HTML5 is being pushed through all media channels – maybe time for me to take a closer look?
How was HTML’s first impression?
First time I looked at HTML/Javascript I didn’t like it (I am going to write HTML in the following when I mean the conglomerate of HTML, JavaScript / ECMAScript and CSS). I couldn’t debug things and had to do trial and error or print messages along the way. It all appeared a big mess to me.
My latest look at HTML5 was much nicer!
Using the Chrome browser I have a debugger – it really debugs my code with full single stepping and breakpoints. I can also set breakpoints on events. The “developer tools” also give me an inspector for elements and the styles used (with inheritance!), I can view the various resources (or assets) used and more things I haven’t used in depth yet like performance monitoring. Developing HTML has come a long way since I first tried it out. Reading through some HTML5 articles, canvas pops out quite prominently. Canvas allows web developers to dynamically draw graphics on the screen without any plug-ins, what was not possible before HTML5 arrived. I decided to write something to try canvas out.
But first I needed an idea
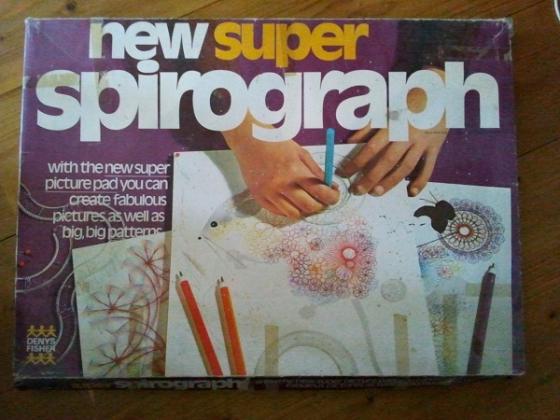
Looking around my home office, my old Spirograph box jutted out of a shelf – my inspiration to write a spirograph app!
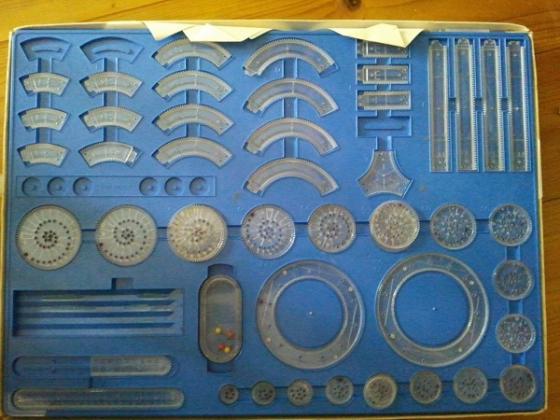
As you can see, most of the bits are still there and I was amazed to find a stack of old drawings I made as a child:
If you don’t know Spirograph, it is basically a flat plastic ring and some gearwheels. The ring is pinned to a sheet of paper on top of some cardboard. Gear teeth are cut on both sides of the ring and the gearwheels have holes for pens. You place the gearwheel on the paper with its teeth intersecting with the teeth on the ring and, with a pen in one of the pen holes, move the wheel around in circles. I used to do this for hours on end. Here is a link to some more History
Spirograph is applied maths based on cycloids. If the gear wheel is moved around the outside of the ring you get a Epitrochoid, moved inside the ring you get a Hypotrochoid.
In my little test app I want to draw the hypotrochoid type curves.
Initial Design
I want a simple user interface allowing the user to:
- Enter the radius of the ring and the wheel
- Enter the distance between the pen and the wheels centre
- Some buttons to easily change the above numbers (+-10, +-1)
- A button to start drawing and a button to clear the drawing
I will also add some code to prepare for changing the colour of the pen and the pen thickness. This can be a future extension.
This is the site I took the maths from: Mathematische Basteleien. The author has a good explanation of the math involved.
The next step is to type it all in. For editing I used Notepad++ and here is the first incarnation of sprio:
spiro1.html
<!DOCTYPE html>
<html>
 <head>
 <title>Spiro-01</title>
  <script type="application/javascript">
    function DrawSpiro() {
        var objCanvas = document.getElementById("canvas");
        var ctx = objCanvas.getContext("2d");
        ctx.save();
        var size = 0;
        if(objCanvas.width<objCanvas.height)
            size = objCanvas.width;
        else
            size = objCanvas.height;
        ctx.translate(size/2,size/2);
        var OuterRadius = document.SpiroInput.OuterRadius.value;
        var InnerRadius = document.SpiroInput.InnerRadius.value;
        var PenOffset = document.SpiroInput.PenOffset.value*InnerRadius/100;
        var PenColour;        // for later extension
        var PenThickness;    // for later extension
        var StartX;            // we start drawing here
        var StartY;            // we start drawing here
        var x,y;
        var Step = Math.PI/180;
        var Angle = 0;
        StartX = (OuterRadius-InnerRadius)*Math.cos((InnerRadius / OuterRadius)*Angle)+PenOffset*Math.cos((1 - (InnerRadius / OuterRadius))*Angle);
        StartY = (OuterRadius-InnerRadius)*Math.sin((InnerRadius / OuterRadius)*Angle)-PenOffset*Math.sin((1 - (InnerRadius / OuterRadius))*Angle);
        ctx.beginPath();
        ctx.moveTo(StartX,StartY);
        do
        {
            Angle += Step;
            x = (OuterRadius-InnerRadius)*Math.cos((InnerRadius / OuterRadius)*Angle)+PenOffset*Math.cos((1 - (InnerRadius / OuterRadius))*Angle);
            y = (OuterRadius-InnerRadius)*Math.sin((InnerRadius / OuterRadius)*Angle)-PenOffset*Math.sin((1 - (InnerRadius / OuterRadius))*Angle);
            ctx.lineTo(x,y);
            ctx.stroke();
        } while ((x != StartX) && (y != StartY));
        ctx.restore();
    }
    function clearCanvas(){
        var canvas = document.getElementById("canvas");
        var context = canvas.getContext("2d");
        context.clearRect(0, 0, canvas.width, canvas.height);
    }
    function OuterP10(){
        document.SpiroInput.OuterRadius.value = String(Number(document.SpiroInput.OuterRadius.value)+10);
    }
    function OuterP1(){
        document.SpiroInput.OuterRadius.value = String(Number(document.SpiroInput.OuterRadius.value)+1);
    }
    function OuterM10(){
        document.SpiroInput.OuterRadius.value = String(Number(document.SpiroInput.OuterRadius.value)-10);
    }
    function OuterM1(){
        document.SpiroInput.OuterRadius.value = String(Number(document.SpiroInput.OuterRadius.value)-1);
    }
    function InnerP10(){
        document.SpiroInput.InnerRadius.value = String(Number(document.SpiroInput.InnerRadius.value)+10);
    }
    function InnerP1(){
        document.SpiroInput.InnerRadius.value = String(Number(document.SpiroInput.InnerRadius.value)+1);
    }
    function InnerM10(){
        document.SpiroInput.InnerRadius.value = String(Number(document.SpiroInput.InnerRadius.value)-10);
    }
    function InnerM1(){
        document.SpiroInput.InnerRadius.value = String(Number(document.SpiroInput.InnerRadius.value)-1);
    }
    function PenOffsetP10(){
        document.SpiroInput.PenOffset.value = String(Number(document.SpiroInput.PenOffset.value)+10);
    }
    function PenOffsetP1(){
        document.SpiroInput.PenOffset.value = String(Number(document.SpiroInput.PenOffset.value)+1);
    }
    function PenOffsetM10(){
        document.SpiroInput.PenOffset.value = String(Number(document.SpiroInput.PenOffset.value)-10);
    }
    function PenOffsetM1(){
        document.SpiroInput.PenOffset.value = String(Number(document.SpiroInput.PenOffset.value)-1);
    }
  </script>
 </head>
 <body>
   <canvas id="canvas" width="400" height="400"></canvas>
   <br/>
    <button onclick="OuterP10();">+10</button>
    <button onclick="OuterP1();">+1</button>
    <button onclick="InnerP10();">+10</button>
    <button onclick="InnerP1();">+1</button>
    <button onclick="PenOffsetP10();">+10</button>
    <button onclick="PenOffsetP1();">+1</button>
   <form name="SpiroInput">
        <input name="OuterRadius" type="text" size="7" value="77">
        <input name="InnerRadius" type="text" size="7" value="29">
        <input name="PenOffset" type="text" size="5" value="68">
    </form>
    <button onclick="OuterM10();">-10 </button>
    <button onclick="OuterM1();">-1</button>
    <button onclick="InnerM10();">-10</button>
    <button onclick="InnerM1();">-1</button>
    <button onclick="PenOffsetM10();">-10</button>
    <button onclick="PenOffsetM1();">-1</button>
    </br>
    <button onclick="DrawSpiro();">Zeichnen</button>
    <button onclick="clearCanvas();">Löschen</button>
 </body>
</html>
Let’s have a look at some bits of the code
The canvas itself is defined done in line 90:
canvas id="canvas" width="400" height="400"></canvas>
All the drawing happens in the function DrawSprio() starting in line 6.
First step in working with canvas is to get a context to work with. All the drawing functions need a context – they don’t work on canvas itself. My context is called ctx:
var objCanvas = document.getElementById("canvas");
var ctx = objCanvas.getContext("2d");
ctx.save();
What I am additionally doing here is saving the current context. This allows me to mess things up and restore the old context when my function exits (using ctx.restore()). That is not necessary for this simple app, but I think it is a good thing to get used to for future, more complex programs.
The maths requires the point of origin to be in the centre of the drawing area. So I have to translate the canvas to that point. First I look for the smallest side and then move the centre to the middle of the canvas:
if(objCanvas.width<objCanvas.height)
    size = objCanvas.width;
else
    size = objCanvas.height;
ctx.translate(size/2,size/2);
Drawing lines on a canvas involves a thing called path. A path is essentially a polygon made of lines and arcs. A path can also have several sub paths. A context only has one path at a time. To draw some lines you need to build a path using functions such as lineTo and moveTo. Then you can change things like line colour and thickness and finally use stroke to draw the path. The next steps in the code are quite straight forward:
- calculate the starting point (the StartX = and StartY = lines) using the maths
- begin a path with ctx.beginPath();
- move the pen to that point: ctx.moveTo(StartX,StartY);
Next is the main loop that terminates when it gets back to the starting point. All the loop does is to calculate the next step (using the same math as for the starting point) and draw to that point: ctx.lineTo(x,y); This doesn’t bring any line to the screen, it adds the line to the path. To make it visible I need this function: ctx.stroke(); The other canvas related function is clearCanvas() that does just that:
- get a context
- clear a rectangle: context.clearRect(0, 0, canvas.width, canvas.height);
The other functions handle the +-10 and +-1 buttons to change parameters.
The app worked but I was not really happy
This needs some optimising
Yes it works but:
- it is very slow
- the +-10 and +-1 button functions are messy
- the main loop has a lot of maths that can be optimised
Before I started to optimise the app I first measured the time it takes to draw a curve using the profiling tool in Chrome to measure the time DrawSpiro takes:
- Test parameters: 175, 50, 130
- Sprio1: 810ms for DrawSpiro
First step: move the stroke function call outside of the main loop:
} while ((x != StartX) && (y != StartY));
ctx.stroke();
ctx.restore();
- Sprio1-1: 7ms
Quite a difference! One big path is much better than many small paths.
2nd step: optimise some of the math in the main loop. Some of the statements never change and could be calculated once outside the loop:
var OmI = OuterRadius-InnerRadius;
var IdO = InnerRadius / OuterRadius;
var IdO1 = 1 - IdO;
…
StartX = OmI*Math.cos(IdO*Angle)+PenOffset*Math.cos(IdO1*Angle);
StartY = OmI*Math.sin(IdO*Angle)-PenOffset*Math.sin(IdO1*Angle);
I needed some new test parameters to get a longer drawing time:
- Test parameters: 181, 47, 130
- Spiro1-1: 310ms on 1st run and 190ms on every other run
- Spiro1-2: 180ms on 1st run, 43ms on every other run
Again, a large performance boost. It shows that the JavaScript interpreter cannot recognise the code portions that don’t change in the loop and make them a constant. This is one of the main differences between a dynamic interpreted language and a compiled language where the optimiser can work its wonders. Odd is that the 2nd and following runs are faster than the very first. I don’t have an explanation for that – maybe you have? Another area for speeding up the app is the resolution I am calculating the steps. Instead of every degree (Step = Math.PI/180) every 10th degree is also very sufficient (Step = Math.PI/180*10).
- Spiro1-2: fresh load 128ms, 2nd try 5ms
Now I have the speed I want – next step clean up the +-10 and +-1 button functions. I started out with one function per plus or minus (just two buttons & one function shown here):
<button onclick="OuterP10();">+10</button>
<button onclick="InnerP10();">+10</button>
function OuterP10()
{
   document.SpiroInput.OuterRadius.value =
      string(Number(document.SpiroInput.OuterRadius.value)+10);
}
All this can be written much more elegantly:
<button onclick="ChangeParam('O',10);">+10</button>
<button onclick="ChangeParam('I',10);">+10</button>
function ChangeParam(param,value)
{
    switch(param)
    {
    case "O": document.SpiroInput.OuterRadius.value  =
        String(Number(document.SpiroInput.OuterRadius.value)+value);break;
    case "I": document.SpiroInput.InnerRadius.value  =
        String(Number(document.SpiroInput.InnerRadius.value)+value);break;
    case "PO": document.SpiroInput.PenOffset.value =
        String(Number(document.SpiroInput.PenOffset.value)+value);break;
    }
}
Now I have quite a nice little app. The formatting of the buttons and surrounding text could be neater and it would be cool to change the pen colour and thickness – that will be something for an extension or you can add on your own.
Source Intel AppUp Developer Program


