We have written before about video sharing service Wistia and enterprise social networking service Yammer. This past week both have added richer analytics to their offerings. If you presently use either or both of them you should start seeing the new features automatically. If not, it might be a good time to investigate what both offer.

Wistia’s service allows you to upload a video and provides an embed code that you post on your website. Once your visitors click on their player, you get all sorts of good stuff about your audience, including:
- Which of your videos is being played most?
- Which belongs on your home page? On your pricing page?
- Which video topic is most engaging for your viewers?
- How do videos and campaigns perform over time?
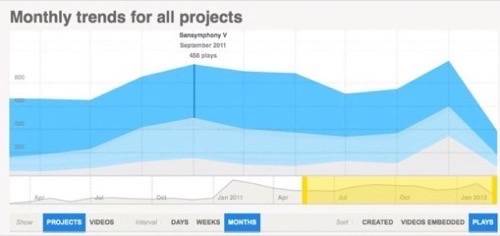
A sample of the new trending graph is shown below. There are tons more analytics available as well, including very sexy heat maps that show you which portions of the video were most often played by each viewer.

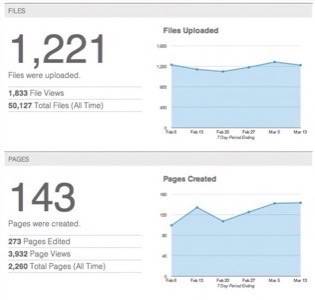
Yammer also has added analytics to their social networking service, so you can see trends on files that have been upload or pages created, as shown in these sample charts. They show activity across members, groups, files and pages over seven and 28-day periods. Statistics provided include number of engaged members, messages, top performing groups and a breakdown of how users are accessing their social networks.

Both vendors are leading the way in their respective fields. The more you know about your networks’ usage of their tools, the better you can deploy them and understand their influence.


