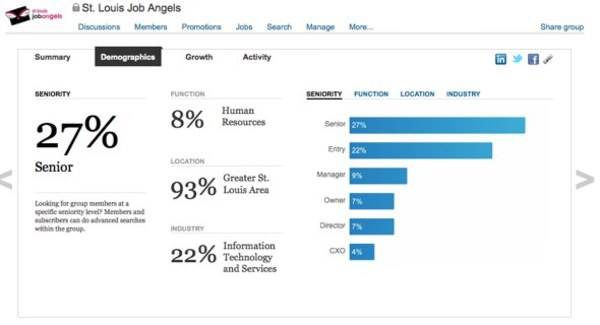
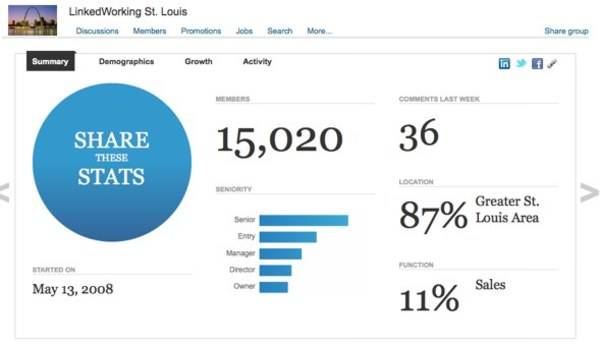
LinkedIn is giving users more information about groups they may wish to join. If you’re wondering which groups to join, or wondering about the makeup of groups you belong to (or manage), LinkedIn has put together stats dashboards for LI groups that will give a ton of info about groups at a glance.

The statistics tool is open to anyone, so you can see the stats for any group you’re thinking about joining. The stats are organized under three categories: Demographics, growth and activity.
Demographics tell you who’s in the group. You’ll see info like the location, industry, roles and seniority level of the members of the group. For example, at a glance you’ll see that new ReadWriteWeb group a strong bent towards media and communications folks, and quite a few folks who consider themselves entrepreneurs. Not surprisingly, Portland is a top location.
Next you’ll be able to see growth. This shows how many members and how quickly they’ve been added. You’ll also see the week-over-week growth rate.
Finally, activity shows just how much the group has going on. This isn’t just the activity in the group itself, but also the activity of group members. It’ll show new jobs in the last week as well as promotions that have taken place in the last week.

If you’d like to help make some stats, be sure to check out the ReadWriteWeb group and the channel subgroups for ReadWriteCloud, ReadWriteEnterprise and ReadWriteHack.
LinkedIn has also added a LinkedIn Events page that gives a list of events that you might be interested in. It will also show events that you’re already attending, and can show attendees that you might want to meet while at events.

If you haven’t been to LinkedIn Groups in a while, you might want to check it out. For professional groups and events, LinkedIn looks to have a lot to offer over other social networks. What do you think of the changes?


