Introduction
SVG stands for Scalable Vector Graphics, originally an XML-based file format for describing two-dimensional vector graphics. As a file format it has been around for more than a decade, long before HTML5 was even envisioned. Several graphic editors – Corel Draw for example – will let you draw using standard tools and save the result as an SVG file. Previous versions of HTML used SVG in the same way as they used other image formats, JPEG, PNG and GIF: you could statically incorporate an SVG image in your html page. Until recently this was practically the only way to get graphics into your web page. But times have changed. Today, rather than creating static or server-generated html pages, we need the ability to create dynamic and user-interactive html apps! HTML5 responds to this need by allowing two approaches to creating graphics, suitable for app development:
- The <canvas> element allows you to dynamically create bitmap drawings (see our article for more details)
- The <svg> element gives you the possibility to integrate vector graphics into your app
SVG vs. Canvas
The two approaches have been known as long as graphics have been around. What is new however, is that with HTML5 you can use them directly in your html code. Let’s briefly revisit the two approaches. Bitmap graphics essentially comes down to saving a list of color values for each pixel in the image. Canvas uses this approach by effectively designating which pixels should assume which colour. It is a so called “procedural” approach, we tell the web runtime (browser or encapsulator in our case) how to draw. Vector approach is on the contrary “declarative”, which means that rather than describing how to draw, it describes what to draw. It is up to the web runtime how to go about it. SVG due to its nature has lots of HTML tags that allow you to create static and animated graphics.
The different nature of the two approaches results in one practical difference worth mentioning. In SVG, for every shape you create, a corresponding tag has to be created. SVG objects are therefore exposed in the DOM. This means that you have a choice of HTML or JavaScript to create vector graphics on an SVG surface. Canvas on the other hand is very much a scripting object and you draw on a canvas object using JavaScript.
Simple Code Sample
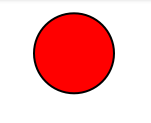
Say you want to draw a black circle with red filling, given its center coordinates, radius and line thickness. With the bitmap approach, i.e. canvas you would have to calculate which pixels need to be coloured black and then carry out the colouring. With the vector approach, i.e. SVG you just need to tell the renderer to draw a circle and pass its parameters. The complete HTML looks like this:
<!doctype html>
<html>
 <body>
  <svg xmlns="http://www.w3.org/2000/svg" version="1.1">
   <circle cx="100" cy="50" r="40" stroke="black"  stroke-width="2" fill="red" />
  </svg>
 </body>
</html>
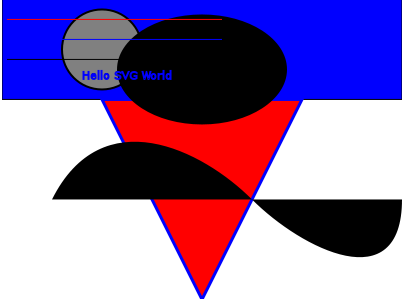
Sligltly More Complex Code Sample
<!DOCTYPE html>
<html>
<body>
 <svg xmlns="http://www.w3.org/2000/svg" width="400" height="400" >
  <rect width="400" height="100" style="fill:rgb(0,0,255);stroke-width:1;stroke:rgb(0,0,0)"/>
  <circle cx="100" cy="50" r="40" stroke="black" stroke-width="2" fill="grey" />
  <path d="M 100 100 L 300 100 L 200 300 z" fill="red" stroke="blue" stroke-width="3" />
  <path  d="M50,200 C100,100 200,150 250,200 S400,300 400,200" />
  <defs>
    <linearGradient id="grad1" x1="0%" y1="0%" x2="100%" y2="0%">
      <stop offset="0%" style="stop-color:rgb(255,255,0);stop-opacity:1" />
      <stop offset="100%" style="stop-color:rgb(255,0,0);stop-opacity:1" />
    </linearGradient>
  </defs>
  <ellipse cx="200" cy="70" rx="85" ry="55" fill="url(#grad1)" />
  <g fill="none">
    <path stroke="red" d="M5 20 l215 0" />
    <path stroke="blue" d="M5 40 l215 0" />
    <path stroke="black" d="M5 60 l215 0" />
  </g>
  <text style="font-size:20; stroke: blue" x="80"  y="80">
    Hello SVG World
  </text>
 </svg>
</body>
</html>
More resources
This is a section to refer to other great articles, tutorials, reference documents, etc … Some good places to look for more information might include:
- Wikipedia on SVG
- Complete SVG reference
- W3 Schools SVG
- Good further reading
Source Intel AppUp(SM) Developer Program


