While some cloud providers build great press about their energy consumption, the truth is data center carbon emissions can actually be much higher than the greenwashing hype would lead you to believe. Most data centers measure energy use, not emissions produced. So one Icelandic start-up cloud provider plans to open source its monitoring software to help cloud providers clear the air about carbon.
Clouding Sustainabiliy
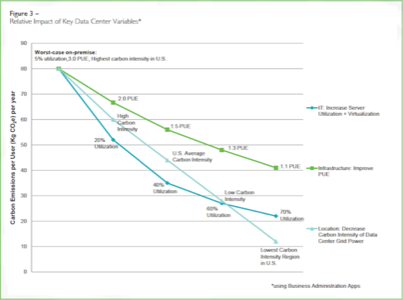
A lot of press has been generated about how cloud computing is a green solution. Intuitively, it certainly feels like increasing energy efficiency should cut energy consumption and carbon dioxide (as CO2) emissions. That’s why cloud services spend a so much time on a stat known as Power Usage Efficiency (PUE), working to achieve a higher utilization of virtual machines on each physical server. Indeed, a recent study from WSP Environment & Energy and the National Resources Defense Council (NRDC) would seem to back up this assertion, as shown in this graph:

In practice, though, there are some wrinkles. For one thing, besides PUE and server utilization, the location of the data center most definitely matters and is intertwined with the other data-center-emission variables – an uncomfortable fact often overlooked in the press releases from major cloud providers and their clients, says Tom Raftery, lead analyst, of the GreenMonk energy and sustainability practice within analyst firm RedMonk.
That raises the second and larger problem: For all the green hoopla surrounding the openings of the new high-efficiency data centers that reportedly sip power, there is a distinct lack of transparency into just how much CO2 emissions these data centers are actually responsible for.
Facebook Is An Open Book
Take, for instance, Facebook’s much ballyhooed Prineville, Oregon, data center, for which the company has open-sourced the highly efficient plans as part of its Open Compute Project. While most new data centers have an average PUE value of 1.5, with older data centers carrying PUEs of around 2, the Prineville facility has a PUE range of 1.07 to 1.08 throughout the year.
But according to Raftery, the Prineville facility’s utility company, Pacificorp, gets 58% of its energy from coal and 12% from gas – that’s more than 70% from fossil fuel directly. And since 22.5% of Pacificorp’s power is purchased from other suppliers, there could be even more fossil fuel hiding in the background. Pacificorp burns an estimated 9.6 million tons of coal per year, Raftery said.
And while Prineville is a model of energy efficiency, it is only one part of Facebook’s total energy consumption. According to Facebook’s own data, in 2011, Prineville used 71 kilowatt-Hours (kWh) of power, just 14% of Facebook’s total of 509 kWh across all of their data centers.
It’s important to note that Prineville did not open until April of 2011. Using Facebook’s carbon-emissions data from the same report, though, we can figure out Facebook’s ratio of carbon emissions to its total data-center power, displayed in this table:
Of the four data centers outlined by Facebook, the West Coast center seems to be doing the best, pulling in the most power and only pushing out a third of Facebook’s total data-center CO2 emissions. But even at low PUEs of 1.08, Prineville is just barely improving upon the carbon-emission/power-consumed ratio, and the new North Carolina data center that opened in April of 2012 is responsible for more carbon emissions for power consumed than even the presumably dirty East Coast colocation facility.
Just as Raftery pointed out this weekend in his keynote address at the CloudStack Collaboration Conference in Las Vegas, the source of a data center’s power is as important to the data center’s total production of emissions as its efficiency ratings. Too often, he added, “energy use” and “emissions produced” have been conflated to mean the same thing. But as outlined here, that’s very much not the case.
Clouding The Picture
Facebook, it should be emphasized, is a very good example of transparency when it comes to data-center (and other) power used and amounts of carbon emitted. We are taking the social network’s reported findings at face value, of course, but at least it is making those reports. Many companies don’t even bother with the details, and still make big claims.
Amazon, for instance, claims that “both the Oregon and GovCloud Regions use 100% carbon-free power,” presumably from a completely renewable energy source. Ask Amazon to explain those claims, however, and all you’ll get is the sound of crickets, Raftery told his audience, like this non-response from Amazon Web Services senior evangelist Jeff Barr.
Salesforce.com also likes to play the sustainability game a little fast and loose. Raftery lambasted the company’s Carbon Calculator, which lets customers select their current location and cloud type to generate a picture of what their annual carbon savings might be if they migrate to Salesforce’s cloud. Raftery said the Europe setting (apparently continents are as granular as Salesforce gets) promises up to 86% annual carbon savings.
“Of course that’s complete horseshit,” Raftery stated. Europe is not homogeneous in its use of fossil fuels for electricity production. While some cloud providers build great press about their energy consumption, the truth is carbon emissions can actually be much higher than the hype would lead you believe.
Clearing The Air
Transparency is key when cloud providers talk about energy and sustainability issues, but Raftery notes that can be hard to achieve even if a company is willing to share its actual data. The problem is that there are few tools and few standards to measure and rate cloud emissions.
In Iceland, a nation that’s fast becoming a data-center hot spot thanks to a 100% renewable energy grid and lots of cold seawater for cooling, start-up cloud provider Greenqloud has made some strong efforts in building software that can monitor the the emissions and energy stats for any cloud system.
Raftery was particularly excited about Greenqloud’s intention to open-source its monitoring code in the second quarter of 2013.Raftery believes that opening this code and incorporating it into open-cloud systems like CloudStack, OpenStack and Eucalyptus will make monitoring emissions easier for cloud providers around the world.
It will still be up to those providers to choose how much information they want to share. But they’ll have one fewer reason not to make their emissions stats more transparent.
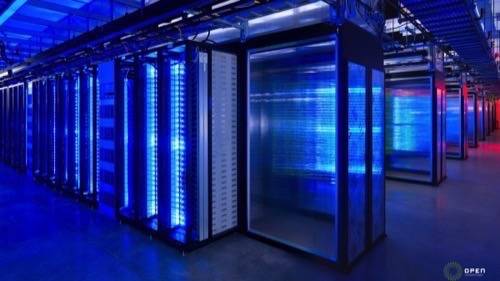
Lead image courtesy of the Open Compute Project.


