Google introduced a new way this week for developers to use geospatial data through its Chrome Experiments initiative.
The new project is called Web GL Globe, an open visualization platform for geographic data that runs in Web GL-enabled browsers like Google Chrome. According to Wikipedia, Web-GL is a “Web-based graphics library that extends the capability of the JavaScript programming language to allow it to generate interactive 3D graphics within any compatible web browser.”
As a start, the Google Arts team created a globe that shows the world population and Google search volume by language.
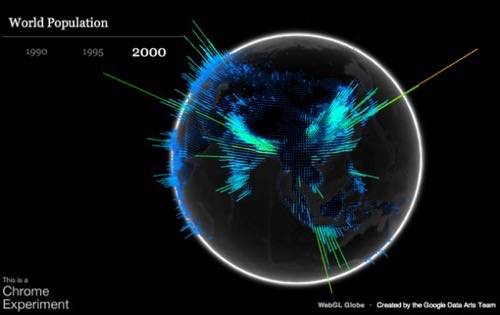
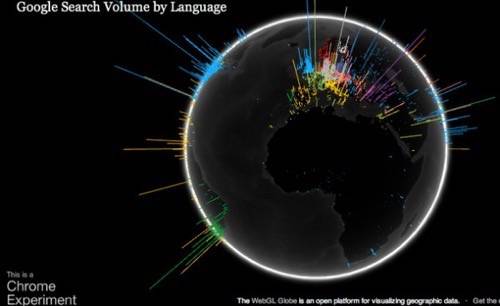
In a blog post, Doug Fritz describes the challenge to draw several thousand 3D graph spikes as smoothly as possible. The team used Three.js, a JavaScript library for building lightweight 3D graphics:
For each data point, we generate a cube with five faces – the bottom face, which touches the globe, is removed to improve performance. We then stretch the cube relative to the data value and position it based on latitude and longitude. Finally, we merge all of the cubes into a single geometry to make it more efficient to draw.
He further describes how they animated the globes:
Thanks to WebGL, we’re able to display thousands of moving points at high frame rates by using the user’s graphics processing unit (GPU) for 3D computations. Each state of the globe has its own geometry and we morph between them with a vertex shader, saving precious CPU resources. Additionally, to make the globe look nice, we took advantage of the possibilities of GLSL and created two fragment shaders, one to simulate the atmosphere and another to simulate frontal illumination of the planet.
Developers are encouraged to make their own globes. The data format is represented in JSON. The the code is available here.
This feels like a taste of what we expect to see at Google I/O this coming week. Google shows its real strength when it starts showing how data can be shaped to make discoveries. That approach fits well into application development and the further use of data in next generation information architectures.