For most of its existence, Firebug has been the de facto JavaScript developers’ console for Firefox; and for several years, most Web development in general involved Firebug to at least some extent. Now with HTML5 developers expecting to see more workbench functionality built into the browser, Firefox finds itself in yet another chase, this time not only with Google Chrome but with Opera and Microsoft Internet Explorer, in a race to incorporate functionality that Firebug users had always thought they had.

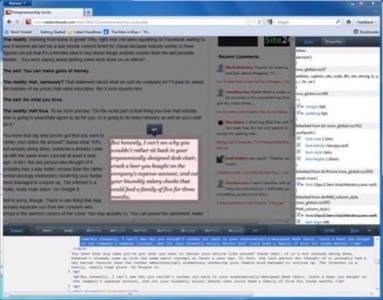
Mozilla’s latest nightly build of Aurora, the development channel for Firefox, reveals the incorporation of at least one new feature in its growing built-in dev toolkit that, while welcomed, will already look familiar to some who’ve sneaked into the Chrome camp: a “bread crumbs” toolbar that represents the relationships between page divisions in the active DOM model, and lets you click on a division name to see it isolated in the browser.
Some months back, Mozilla rolled out an addition to its built-in Firefox dev tools that lets you highlight and focus on an element with a bit more animated style. The Inspect function (Ctrl + Shift + I) lets you scoot the mouse over the rendered page to see the location and identity of the element under the pointer. While in Inspect mode, the HTML code for the highlighted elements shows up in a separate window. This seems nice enough until you try to use it for real work. To stop the code window from updating itself for every element under the pointer, you click on the element you want to inspect in order to hold the highlighter in place. Then you can go to the HTML window to scroll through the code, but in the meantime, the page has returned to its regular behavior, albeit with a polarized film over most of it. You can’t easily move from element to element without clicking on the white “X” in the upper right corner, which is sometimes easy to miss.

The revision of this feature in the latest Aurora builds is a vast improvement, even if Mozilla had to borrow another feature from Chrome to pull it off. When you press Ctrl + Shift + I, the new bread crumbs toolbar appears along the bottom. The highlight still follows your pointer, but now a flag appears along the top of the highlight bearing the name or type of the highlighted element. You can click any element in the bread crumbs list to see that element highlighted. And to return to the animated selection mode, you just click the Inspect button on the lower left corner.

Now instead of a separate window, the source code is now hidden within retractable panes. The HTML button brings up the source code that you’d find within the separate window of Firefox’ current release builds, while the Style button brings up a CSS navigator along the right side. The borders for both panes are easily dragged from side to side to make room.
While Mozilla had been experimenting from time to time with relocating the Web Developer console (where errors are reported, among other things) from the bottom to the top of the active window, in current release builds, Mozilla places it back along the top by default. A Position button lets the developer move the console to the bottom, or detach it into a separate window. Although all these tools are often simultaneously necessary, things may get a bit crowded for Mozilla developers with all these panes competing for real estate.


