If there’s one thing we know about Web authors it’s that they are constantly seeking new sources of traffic for their content. It doesn’t matter if you’re a blogger, a marketing manager or a small business owner, there is simply no reason to invest time with content creation and Web design if no one is coming to read it. For this reason, it’s important to figure out where to actually invest time for the greatest ROI.

As a blogger I routinely asked myself the same question, until I finally realized that I (as the CEO of Woopra, the Web analytics company) had access to all the data I needed to make an absolute determination about which areas deserve the most attention.
Guest author John Pozadzides is the CEO of the Web analytics company Woopra, organizer of the open-source blogger and developer conference OpenCa.mp, and the man behind OneMansBlog.com. Follow him on Twitter @johnpoz.
This meant looking beyond my own site’s statistics and finding out what was broadly occurring across all domains. Only through a comparative analysis can we determine where our strengths and weaknesses lie as compared to the average.
The Methodology
Woopra monitors well over 100,000 websites, however, all of our client’s data is kept separate for security and privacy reasons. This meant the first step was to set up a new specialized server that would poll all other servers in our network in order to aggregate the data.
After building this new platform, the Woopra team provided me with the raw information that I used to create the charts below. This report is based on hundreds of millions of data points collected during the month of June 2010.
Virtually every category of Website is represented in the dataset – education, news, government, SMB, Fortune 500, blogs, adult – and while it clearly doesn’t reflect all of the sites on the Internet, my guess is that it is a statistically significant and representative sampling.
Top Referrers of Traffic
For the purposes of this analysis, referrers have been segmented into different categories in order to more easily compare traffic. For example, there is no use in comparing Google to Flickr since they are not categorically related. If we’re making a determination which search engine to focus on, Flickr would not be in the mix – and if we’re looking for a photo hosting site, Google would not be in the mix. The four main referral categories that drive virtually all traffic are: Search Engines, Media, Social Bookmarks and Social Networks.
Social Network Referrers
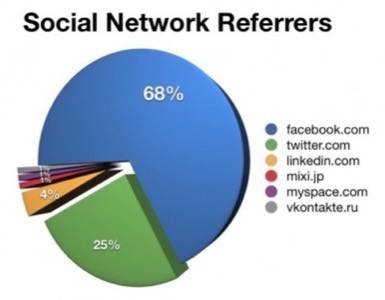
Perhaps the one result that was the most surprising is the Social Networking category. Although Twitter seem to be the talk of the town, Facebook is the 900 pound gorilla when it comes to actually driving website traffic, sending nearly 7 in 10 visitors from the Social Network category. LinkedIn comes in a distant yet still respectable third place.
There is one giant unknown in this area, however. Many Twitter users access the service through applications instead of via Twitter’s website. These applications do not report http-referrer data to Web servers, which makes it impossible to tell where the clicks originate. The same can be said about traffic driven by mobile apps (including Facebook).

All of the other players in the Social Networking category cumulatively amount to less than 3% of inbound website traffic.
Social Bookmark Referrers
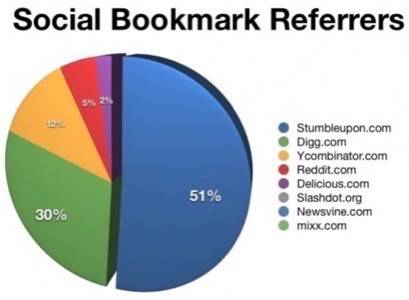
Social bookmarking sites are also extremely sought after sources of traffic, with the highest profile member of the group being Digg. Interestingly, this is another case where a smaller source seems to receive a disproportionate amount of attention, since StumbleUpon drives nearly double the traffic to websites.

Another surprising standout in the Social Bookmark category is YCombinator’s Hacker News site, which drives 12% of the traffic in this category. Reddit and Del.icio.us drive 5% and 2%, respectively. Interestingly, SlashDot (the grandaddy of them all) drives close to 0% of traffic to the sites Woopra measures – although webmasters still call the rush of traffic that can take down a website a “Slashdotting”.
Search Referrers
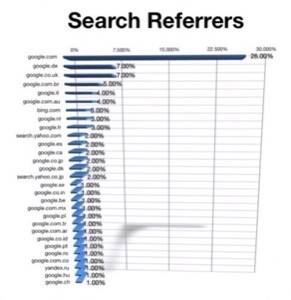
In the Search Engine space, perhaps the only surprise is the absolute dominance of Google when it comes to actually driving traffic to websites. For example, Experian’s Hitwise published a press release setting Google’s share of the search market at 72% in May 2010. However, Woopra is seeing 92% of search visitors originating from Google.

This begs the question: Where does the discrepancy lie?
- Is the Hitwise data set more representative of the whole?
- Are there more searches taking place on other search engines that don’t result in click-throughs to websites?
- StatCounter’s Global Stats seem to closely mirror Woopra’s data.
Regardless of the reason, what we do know is that focusing attention on optimizing for Google search is absolutely the right thing to do. (Here’s the official Google SEO starter guide.)
Media Referrers
The media referrer category is reserved for sites that focus on various forms of multimedia, including images, video and audio. These sites are often overlooked as a source of traffic because they are destination sites; however, media sites can also drive large volumes of traffic.
As an example, world-famous HDR photographer Trey Ratcliff posts travel photos on Flickr, and includes a simple link back to his site in the description of each image he posts.

This technique generated nearly 13,000 pageviews on StuckInCustoms.com in April alone.

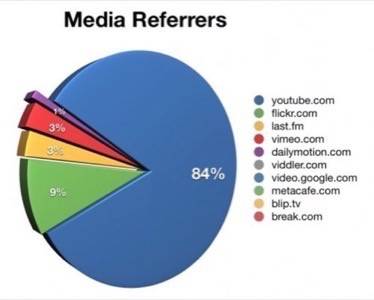
What’s more notable is that Flickr is not the dominant referrer in the Media category. YouTube drives 900% more traffic to websites than Flickr. This is accomplished the same way, via links in the description of the video.

Amazingly, 99% of referrer traffic in the Media category comes from only four providers: YouTube, Flickr, Last.FM and Vimeo.
Lessons Learned
The only question we are trying to answer with this analysis is where it makes sense to focus resources and attention in order to drive traffic. So here’s what we know:
- Search engine optimization specifically targeting Google’s index is key. Working hard to satisfy other search providers probably won’t pay off as much as spending the time elsewhere – like Facebook and Twitter promotion.
- If multimedia isn’t part of a site’s strategy to drive traffic, it should be. Adding photos to Flickr and videos to YouTube will not only pay off in terms of adding content for your brand, but will also drive eyeballs to your site.
- Sites that are not seeing traffic from Facebook, Twitter, or both, are missing out on a major traffic-generation source. Additionally, if the balance is not in Facebook’s favor, you are likely under-utilizing this channel.
- Don’t waste time promoting your site on any Social Media network other than Facebook, Twitter or LinkedIn. Your time is better spent elsewhere (like YouTube or Flickr for example).
- By all means, submit articles to Digg in the hopes of making it to the homepage, but more importantly make sure articles work their way into StumbleUpon, which can bring a larger, more sustained and less server-crash-creating stream of traffic.
- For those looking to more accurately track Twitter click-throughs, some service providers such as Bit.ly enable tracking of short links. The bad news is that the tracking is not aggregated into existing Web analytics provider data.
- This analysis doesn’t take into consideration back-links (which Web authors should pursue whenever possible) because on the aggregate they do not drive global traffic. However, links from related or high-traffic sites can not only dramatically increase site traffic, they can positively impact search result listings.
Questions, comments or alternative interpretations? Drop a comment below and let us know!
Top photo by Lars Sundstrom


